Original Articles: 2020 Vol: 12 Issue: 11
Theoretical Studies on the Copper Corrosion Inhibition by Vitamins B1, B2 and B6 in 1 M HNO3 Using DFT and QSPR Methods
Mougo André Tigori1*, Amadou Kouyaté1, Victorien Kouakou2, Paulin Marius Niamien2 and Albert Trokourey2
1 UFR Environment, Université Jean Lorougnon Guédé, BP 150 Daloa, Côte d’Ivoire
2 Laboratoire de Chimie Physique, Université Félix Houphouët Boigny, 22 BP 582 Abidjan 22, Côte d’Ivoire
Abstract
Keywords
Inhibition properties, Inhibition efficiencies, Thiamine hydrochloride, Riboflavin, Pyridoxine hydrochloride
Introduction
Metal and alloys corrosion are a universally known phenomenon that results in significant direct and indirect material losses to industry and the collectivity each year. Indeed, the replacement of corroded equipment and materials constitutes a very high financial burden for industry. In addition, there is the loss of income corresponding to the shutdown of the facilities needed to carry out the repairs. The corrosion of a metal or alloy can develop according to different processes that characterize each type of corrosion. Even more serious, corrosion can cause irreversible damage to the environment and even loss of life. Because it can lead to health problems (pollution, contamination, etc.) To reduce this phenomenon, several researchers have developed different methods. Among these methods we have corrosion inhibitors. The new international guidelines on industrial releases are becoming increasingly strict in terms of ecology and the choice of eco-friendly corrosion inhibitors is becoming an important stake [1]. That is why a lot of research today is focused on organic inhibitors, which are little toxic and stable at high temperatures. The use of therapeutic molecules, such as vitamins in our work answers the requirements of the new international environmental protection guidelines. Several studies in the literature were about the action of some vitamins, including vitamin B3 [2], vitamin B2 [3], vitamins B1 and C [4] have been used as mild steel corrosion inhibition in different acidic solutions. Though vitamin E [5] has been used for copper protection in acidic solution. The quantum chemical calculations have been used recently to explain the mechanism of corrosion inhibition. They are very helpful in understanding the relationship between the corrosion the structural and inhibition properties of a wide range of organic corrosion inhibitors [6,7]. The use of Density Functional Theory (DFT) method is a common practice. This theory is based on the Hohenberg and Kohn theorem [8] which shows that the energy of the fundamental state of the molecule is the only functional of electronic density. Kohn and Sham [9] developed this part later from a fictitious system (without interactions between the constituents). These theoretical calculations [10] contribute to a better understanding of the inhibition properties of the studied molecules and to the analysis of global and local reactivity parameters [11-16].
QSPR is an alternative method to experimentation that is recommended by the new regulations [17] because it provides additional details on molecular structure descriptors and data analysis tools needed to set up and validate predictive models [17]. Thus, many molecules may need to be analyzed to prove their inhibition performance.
The aim of this present paper is to analyze the inhibition properties of three vitamins which are thiamine hydrochloride (vitamin B1): 3-((4-Amino-2-methyl-5-pyrimidinyl) methyl)-5-(2-hydroxyethyl)-4-methylthiazolium chloride hydrochloride, riboflavin (vitamin B2): 7, 8-Dimethyl-10-[(2R, 3R, 4S)-2, 3, 4, 5-Tetrahydroxypentyl] benzo[g]pteridine-2, 4-Dione and pyridoxine hydrochloride (vitamin B6): 4.5-Bis (hydroxymethyl)-2-methyl-3- pyridinol, hydrochloride (1:1) in order to show the correlation between their inhibition efficiencies and quantum chemical parameters and also to find the best set of structural and reactivity parameters.
Materials and Methods
Mass loss technique
The values of the inhibition efficiencies were provided by the mass loss method, which consists of performing gravimetric measurements on copper samples with an S surface. These samples were immersed in the 1 M concentration nitric acid solution in the absence or presence of different concentrations of each vitamin maintained at temperatures of 25°C and 55°C for 1 hour. Then the difference in mass of each sample was determined before and after each test.
The corrosion rate (W) and the inhibition efficiency were calculated using the following:

Δm: is the mass loss (g); m1 and m2 are respectively, the weight (g) before and after immersion in the solution test; t: the immersion time (h); Se: the total surface of sample (cm2) ; w0 and w ; are respectively the corrosion rates of copper in the absence and presence of each molecule.
DFT method
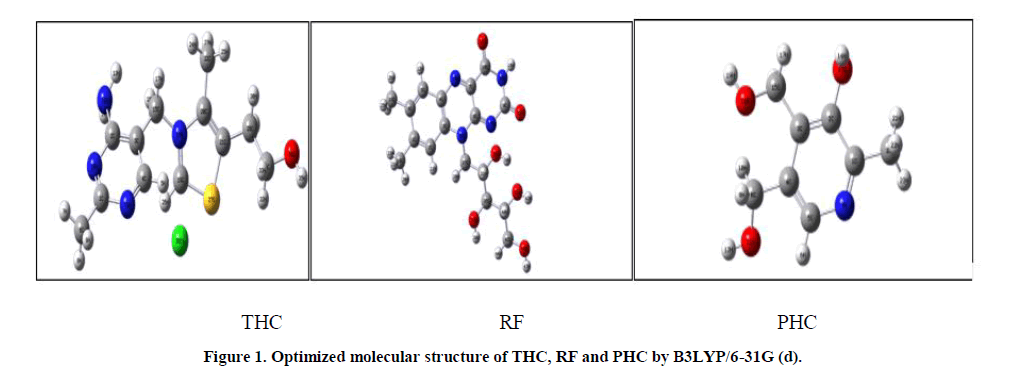
Theoretical calculations were carried out using Gaussian 03W software [18]. The geometry of each compound has been optimized using DFT (Density Functional Theory) at the B3LYP with the Becke’s three parameters exchange functional of Lee, Yang, and Parr (LYP) [19] with 6-31G(d) basis set. These calculations give access to a set of quantum chemical parameters which help to elucidate the electronic structure of chemical systems. The optimized structures of the different compounds are shown in Figure 1.
Global parameters were calculated to explain the correlation between inhibition efficiencies and quantum chemical parameters.
The chemical potential  of the electronic cloud measures the tendency of the electronic cloud to escape from the molecule [20]:

In this relation (1), E is the total energy, N is the number of electrons and (r) is the external potential of the system.
The energies of HOMO and LUMO are related to I and A, respectively in framework of Koopmans’ theorem [21].

Referring to Koopmans theorem [21,22], the electronegativity  and the global hardness
  can be written in terms of ionization potential
  and the chemical affinity (A) or either in terms of HOMO or LUMO energies.

The global electrophilicity index  introduced by Parr [23], and calculated using the electronic chemical potential and chemical hardness is given by:

According to Pearson theory [24] the fraction of transferred electrons (ΔN) from the inhibitor molecule to the metallic atom can be calculated. For a reaction of two systems with different electronegativities (as a metallic surface and an inhibitor molecule) the following mechanism will take place: the electronic flow will occur from the molecule with the lower electronegativity toward that of higher value, until the chemical potentials are the same. For the calculation, the following formula was used [24].

We use the theoretical value of  [24], for the calculation of the number of transferred electrons.
QSPR method
This method is an elaboration of mathematical models linking physicochemical properties and biological activities to the molecular structure allows, on the one hand, to explain the origin of these activities/properties and, on the other hand, to predict them for molecules for which experimental data are not available. QSPR concept can be used to relate the inhibition efficiency of most organic inhibitors to their structural parameters; the resulting mathematical relationship [25] is a means of detecting new inhibitors. In order to find a relationship between inhibition efficiency and quantum chemical parameters of the molecule, we will apply the non-linear multivariate model proposed by Lukovits et al. [26] which is based on the Langmuir adsorption isotherm, for the study of interactions between corrosion inhibitors and metal surfaces in acidic environments. This model [27] is represented by the relationship:

Where Ci represents the different values of the inhibitor’s concentrations. A and B are real constants which will be determined when solving the system of equations.
Using four inhibitors concentrations, we tested sets of three parameters (x1, x2, x3). In this case, the equation becoming:

It is a question of finding for the molecule the set of coefficients A, B, D and E which make it possible to obtain the value of inhibition efficiency closest to the experimental value. The calculations have been performed using EXCEL software.
UV spectroscopy
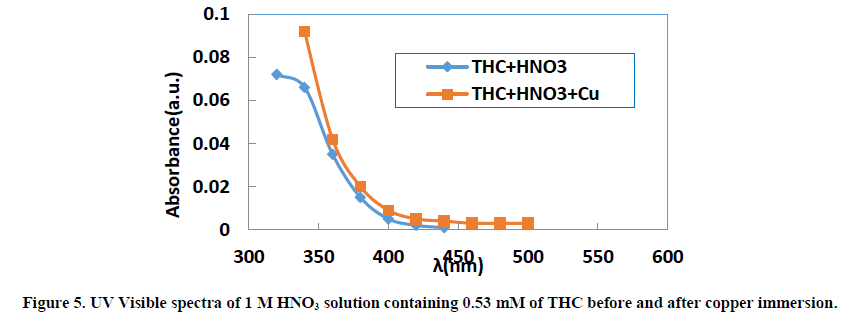
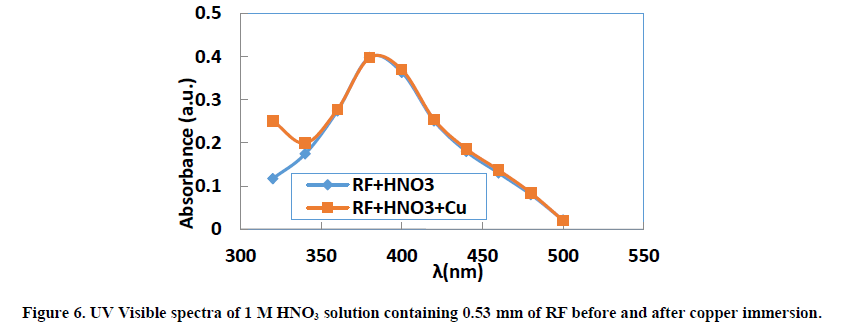
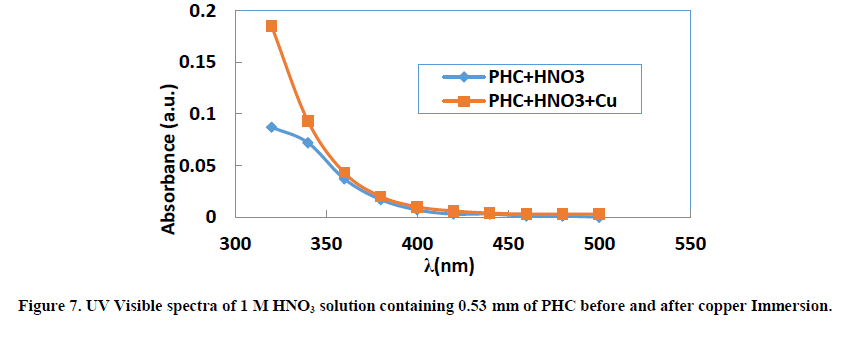
UV Visible spectrum has been used to analyze the adsorption behaviour of THC, RF and PHC to study the interaction between each molecule and copper surface. UV visibles absorption spectra obtained from the following solutions:
• Nitric acid solution 1 M containing the inhibitor (0.53 mM)
• Nitric acid solution 1 M containing the inhibitor (0.53 mM) and the copper which has been in it for 24 hours at room temperature.
Quantum chemical interpretation
Global reactivity parameters calculated using B3LYP/6-31G(d) and inhibition efficiencies obtained at 55°C with the inhibitors concentrations is 0.53 mM. These different values are recorded in the Table 1.
The quantum chemical parameter EHOMO indicates the capacity of a molecule to donate electrons to an acceptor system. According to [28] high value of EHOMO is the ability of that molecule to donate electrons to appropriate acceptor molecule of low empty molecular orbital energy. The high EHOMO values of three molecules justify the good inhibition efficiencies for copper corrosion in nitric acid solution.
The ability of a molecule to form bonds with a metal surface [28] also depends on the value of the ELUMO (Lowest Unoccupied Molecular Orbital energy). Indeed, organic inhibitors not only provide electrons to orbitals, metal ions such as Cu2+ ([Ar]3d9), but they can also receive electrons from these orbitals, which leads to a mutual exchange of electrons. In our case the lower value of ELUMO signifies that the molecule would accept electrons. That reflects the good performance of the compounds studied. The higher value of EHOMO and the lower value of ELUMO for different molecules can explain the adsorption on the metallic surface when compared to values in the literature [29,30]. In Table 1,the values of ELUMO follow the order RF<THC<PHC, This shows that RF has a high ability to accept electrons from copper, which favors a good capacity to inhibit copper corrosion compared to the two molecules, which is in agreement with the experimental results.
| THC | RF | PHC | |
|---|---|---|---|
| Inhibition efficiency IE (%) | 82.82 | 86.26 | 84.85 |
| EHOMO (eV) | -5.838 | -5.932 | -6.114 |
| ELUMO (eV) | -1.681 | -2.512 | -0.654 |
| Energy gap DE (eV) | 4.157 | 3.420 | 5.466 |
| Dipole moment µ (D) | 7.551 | 11.527 | 2.1459 |
| Ionization energy I (eV) | 5.838 | 5.932 | 6.114 |
| Electron affinity A (eV) | 1.681 | 2.512 | 0.648 |
| Electronegativity c (eV) | 3.759 | 4.222 | 3.381 |
| Hardness h (eV) | 2.078 | 1.710 | 2.733 |
| Softness S (eV)-1 | 0.481 | 0.585 | 0.366 |
| Fraction of electron transferred DN | 0.294 | 0.223 | 0.292 |
| Electrophylicity index w | 3.399 | 5.212 | 2.091 |
| Total energy ET (Ha) | -1620.1 | -1330.20 | -591.86 |
Table 1. Inhibition efficiency and quantum chemical parameters of THC, RF and PHC
Energy gap (ΔE), is an important parameter as a function of reactivity of the inhibitor molecule towards the adsorption on the metallic surface. Larger value of the energy gap difference will provide low reactivity to a chemical species. on the other hand, lower values of the ΔE will render good inhibition efficiency, because the energy required to remove an electron from the lowest occupied orbital will be low [31,32]. The calculations from Table 1 show the following order RF<THC<PHC, which suggests that RF has the highest reactivity in comparison to the other compounds and would therefore interact strongly with the copper surface.
The dipole moment (μ) is an indicator that is also used in the process of corrosion inhibition because it is a measure of the polarity in a bond and is related to the distribution of electrons in a molecule [33]. Some authors state that adsorption between the inhibitor and the metal surface can be favored by a high value of the dipole moment [34,35]. However, many other authors [36,37] state that low dipole moment values favor the adsorption process. In our study, the dipole moments of RF and THC are high while those of PHC is low. So, in general, taking these contradictory views, there is no relationship between dipole moment and inhibition efficiency.
Global softness (S) and global hardness  are also important parameters because it measure the molecular stability and reactivity. A hard molecule has a large energy gap and a soft molecule has a small energy gap [38]. It is shown from the calculations that RF has the least value of global hardness (1.710 (eV)) and the highest value of global softness (0.585 (eV)) is expected to have the highest inhibition efficiency. These results are consistent with experimental inhibition efficiencies.
For the three molecules,  the charge transfer from each molecule to the metal is energetically favored [39].
Ionization energy (I) is a fundamental descriptor of the chemical reactivity of atoms and molecules. High ionization potential indicates high stability and chemical inertness and small ionization energy indicates high reactivity of atoms and molecules [40]. The low ionization energy of the three molecules indicates their high inhibition efficiency. This low value of I and high value of A when compared to values in the literature [41,42], indicate the capacity of the molecules both to donate and accept electrons.
Electronegativity indicates the ability of a molecule to accept electrons. According to Sanderson's principle of electronegativity equalization [43], the molecule has a high electronegativity is low reactive and has a low inhibition efficiency, however, good inhibitors are generally those that are able to donate electrons to the metal surface, have a low electronegativity value, and have a high electronegativity value. In our case the three molecules have low electronegativity than copper  therefore they have a good inhibition efficiency. Which is agreement with the experimental results obtained.
The electrophilicity index (ΔN) was also determined. According to the definition, this indicator expresses the ability of the inhibitor to accept electrons. So, a high value of electrophilicity index [31] describes a good electrophile while a small value of electrophilicity index denotes a good nucleophile. In our study, this value follows the trend PHC<THC<RF, which shows that PHC has the lowest electrophilicity index value this confirms his lower ability to accept electrons. The molecules can accept electrons from copper.
Quantitative Structure Activity Relationship studies (QSPR)
QSPR is a theoretical model which help to predict the inhibitor performance because it allows to find the right set of parameters for the molecule [44]. The development of an effective theoretical model starts with the collection of reliable experimental data. The different inhibition efficiencies values at 298 K of the compound studied are recorded in Table 2.
| Concentration (μM) | 130 | 180 | 280 | 530 |
|---|---|---|---|---|
| IE (%) THC | 35.24 | 47.79 | 56.82 | 67.61 |
| IE (%) RF | 41.71 | 46.03 | 64.03 | 71.94 |
| IE (%) PHC | 31.99 | 39.55 | 53.59 | 61.14 |
Table 2. Inhibition efficiencies at T= 298 K for different concentrations of THC, RF and PHC.
The coefficients values for different sets of three quantum chemical parameters of THC, RF and PHC are listed in Tables 3-5 respectively.
| Set of Parameters | A | B | D | E |
|---|---|---|---|---|
| (ΔN, ω, η) | -8.8962 | 65.1741 | -46.8996 | -121.4497 |
| (EHOMO, μ,ω) | -121.7735 | 137.1438 | -18.31792 | -1684.2200 |
| (EHOMO, μ, ELUMO | -176.7528 | 12.6757 | -31.5342 | -1180.6020 |
| (ΔE, μ, ΔN) | -49.5736 | -208.0185 | -68.8188 | 1797.0625 |
| (ELUMO, EHOMO, S) | 85.2465 | 45.8020 | -125.9435 | 471.2743 |
| (ΔE, μ, ω) | 205.4130 | 247.1577 | 208.7145 | -3429.6061 |
Table 3. Values of coefficients A, B, D and E for different sets of three quantum chemical parameters of THC.
| Set of Parameter | A | B | Δ | E |
|---|---|---|---|---|
| (ΔN, ω,η) | 51.4394 | -66.10533 | 157.4566 | 63.8248 |
| (EHOMO, μ, ω) | 8.5546 | 18.04525 | -5.21169 | -130.0935 |
| (EHOMO, μ, ELUMO | 1108.0934 | 857.7279 | 2791.1971 | -1505.1173 |
| (ΔE, μ, ΔN) | -30.8863 | -39.630032 | -120.3586 | 589.2917 |
| (ELUMO, EHOMO, S) | 16.5862 | -10.2756 | -40.0737 | 4.15812 |
| (ΔE, μ, ω) | 40.7442 | 129.2225 | -272.7312 | -207.4135 |
Table 4. Values of coefficients A, B, D and E for different sets of three quantum chemical parameters of RF.
| Set of Parameter | A | B | Δ | E |
|---|---|---|---|---|
| (ΔN, ω, η) | 98.3354 | 13.8792 | -100.1622 | 216.0114 |
| (EHOMO, μ, &ω) | 341.0089 | -196.5621 | 154.1246 | 320.5052 |
| (EHOMO, μ, ELUMO | -793.313 | -667.0582 | -93.2835 | -3479.3189 |
| (ΔE, μ, ΔN) | -257.9061 | -241.9960 | 341.1442 | 1829.4032 |
| (ELUMO ,EHOMO, S) | -431.0484 | 280.5442 | 2141.0591 | -3237.2610 |
| (ΔE, μ, w) | -140.8701 | -3.9312 ×10¹² | 1.9983 ×10¹² | 4.2576 ×10¹² |
Table 5. Values of coefficients A, B, D and E for different sets of three quantum chemical parameters of PHC
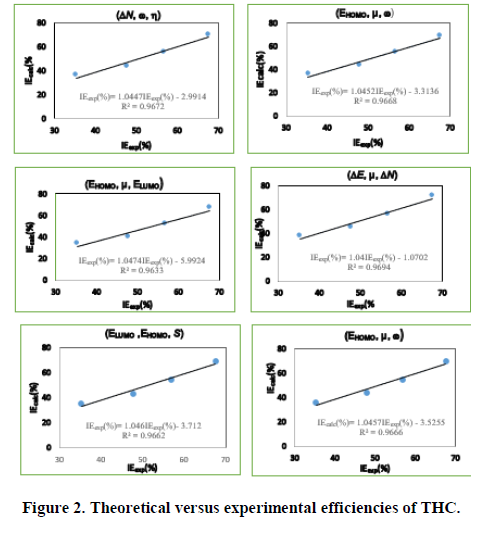
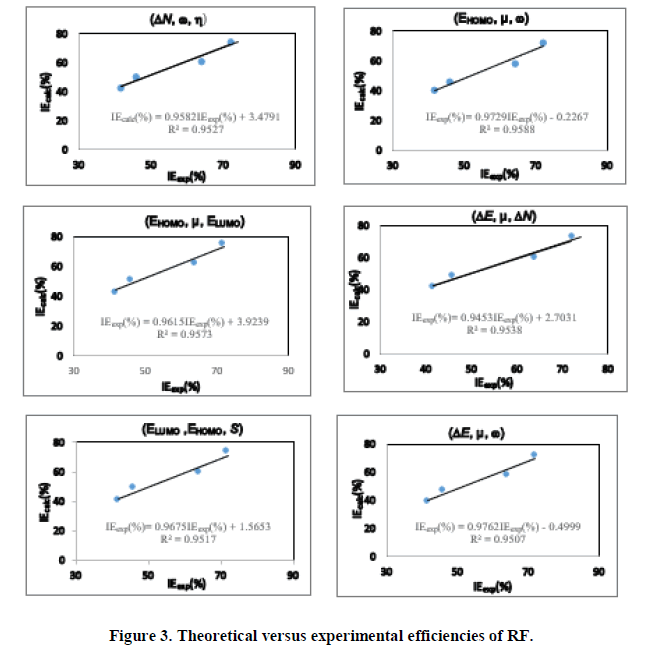
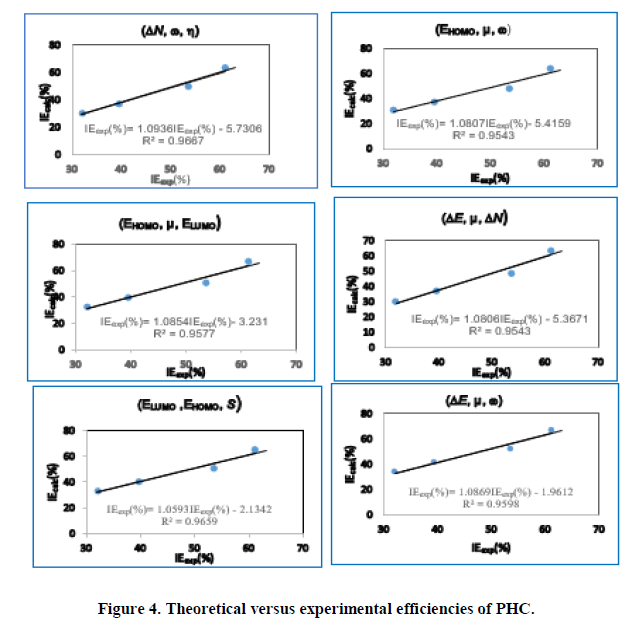
Using equation (12), the values of the theoretical inhibition efficiencies were determined. The estimated efficiencies versus the experimental values of THC, RF and PHC are given respectively in Figures 2-4.
These different sets of descriptor parameters of each molecule lead to a mathematical relationship that allows us to predict its behavior in copper corrosion in nitric acid solution. In this work, each set of molecular descriptors studied leads to an equation linking these parameters to corrosion inhibition. Once developed, the model must be validated based on correlation coefficients. We observe that the different correlation coefficients R2 are quite close to unity. To determine the set of parameters that best describes the behavior of each molecule, we will analyse the other statistical parameters. The statistical indicators that will allow us to make this analysis are:
The Sum of Square Errors (SSE):

The Root Mean Square Error (RMSE):

The different values of these statistical indicators of THC, RF and PHC are recorded in Tables 6.
| THC | RF | PHC | |||||||
|---|---|---|---|---|---|---|---|---|---|
| Set of Parameters | R2 | SSE | RMSE | R2 | SSE | RMSE | R2 | SSE | RMSE |
| (ΔN, ω, h) | 0.9672 | 23.90 | 2.44 | 0.9527 | 34.67 | 2.94 | 0.9667 | 33.68 | 2.90 |
| (EHOMO, μ, ω) | 0.9668 | 26.14 | 2.55 | 0.9588 | 37.85 | 3.08 | 0.9543 | 44.29 | 3.33 |
| (EHOMO, μ, ELUMO | 0.9633 | 75.24 | 4.34 | 0.9573 | 40.50 | 3.18 | 0.9577 | 33.23 | 2.88 |
| (ΔE, μ, ΔN) | 0.9694 | 24.23 | 2.46 | 0.9538 | 29.30 | 2.71 | 0.9543 | 43.08 | 3.28 |
| (ELUMO, EHOMO, S) | 0.9662 | 29.86 | 2.73 | 0.9517 | 30.43 | 2.76 | 0.9659 | 24.06 | 2.45 |
| (ΔE, μ, ω) | 0.9666 | 27.87 | 2.64 | 0.9507 | 46.37 | 3.40 | 0.9598 | 47.23 | 3.44 |
Table 6. SSE and RMSE of THC, RF and PHC
The most appropriate set of parameters for describing the behavior of thiamine hydrochloride (THC) seem to be  The degree of correlation between the theoretical and experimental efficiency values is expressed by the correlation coefficient value (R2=0.9672) and the value of SSE (23.90) and RMSE (2.44) are the lowest.
The set of parameter  with the correlation coefficient of QSPR model is R2=0.9538 has the lowest values of SSE (29.30) and RMSE (2.71) can be considered at the best set for Riboflavin (RF).
For pyridoxine hydrochloride the best set of parameter seem to (ELUMO, EHOMO, S) for which the correlation coefficient value is R2=0.9659, the sum of square errors (24.06) and the root mean square error (2.45) are the lowest.
The sets of parameters (ΔE, μ, ΔN), (EHOMO, μ, ω) (ΔN, ω, η) respectively for THC, RF and PHC lead to satisfactory correlations. The correlation coefficients are (R2=0.9694), (R2=0.9588) and (R2=0.9667). Although these sets lead to a satisfactory correlation between theoretical and experimental efficiency values, they are not the most appropriate to describe the behavior of molecules. Because the statistical indicators are not the lowest.
Therefore, correlation coefficients alone are not recommended to validate the QSPR model when describing the behavior of a molecule. Statistical indicators need to be combined to have a rigorous and complete validation.
UV-visible spectroscopy
UV visible absorption spectroscopy allows to check the formation of a possible layer on the metal surface. The absorbance values for the different wavelengths applied to each molecule were determined. Figures 5-7 show the evolution of absorbance as a function of wavelength (λ) for THC, RF and PHC, respectively.
The visible bands of different absorption spectra of the three inhibitors are generally between 320 nm and 500 nm. When copper remains for 24 hours in the 1 M nitric acid solution, we observe for the same wavelengths a slight increase in absorbance for each molecule studied. This slight increase in absorbance at the same wavelengths is related to the transitions π→π* and n→π* [45], which confirms the electron transfers between the inhibitor molecules and ions Cu2+ leading to the formation of Cu-Inh complexes. These different transitions reveal the presence of C=O or O-H groups in the molecules studied. Indeed, according to the literature [46], the change in the position of absorption maximum or change in the value of absorption when a metal is in the presence of an organic compound in solution indicates the formation of a complex between the two species.
Coclusions
The three vitamins THC, RF and PHC have good inhibition properties for the copper corrosion in nitric acid solution where RF is the best inhibitor. Density Functional Theory (DFT) was used to determine the descriptive and reactivity parameters of the different compounds which were used in the QSPR theory to establish, from the Lukovits model, a mathematical relationship that allows to approach the inhibition efficiency of each compound. The most appropriate set of parameters to describe the behavior of the studied compounds was found. The UV visible studies reveal the formation of copper inhibitor complex. The comparison of theoretical and experimental data shows a good correlation confirming the reliability of quantum chemical methods for studying the corrosion inhibition of metals.
References
- E Stupnišek-Lisac; N Galić; R Gašparac. Corrosion. 2000, 56(11), 1105-1111.
- S Bashir; V Sharma; S Kumar; Z Ghelichkhah; IB Obotd; A Kumara. Portugaliae Electrochimica Acta. 2020, 38(1), 107-123.
- MA Chidiebere; EE Oguzie; L Liu. Mat Chem Phys. 2015, 56, 95-104
- RA Ahmed. Oriental J Chem. 2016, 32(1), 295-304.
- R Fucks-Godec; G Zergav. Corros Sci. 2015, 97, 7-16.
- J Radilla; GE Negrón-Silva. Electrochimica Acta. 2013, 112, 577-586.
- EZ Adnani ; M Mcharfi; M Sfaira; M Benzakour; AT Benjelloun; M Touhami Ebn. Corros Sci. 2013, 68, 223-230.
- P Hohenberg; W Kohn. Phys Rev. 1964, 136, B864-B871.
- W Kohn; LJ Sham. Physical Rev. 1965, 140, A1133-A1138.
- FM Bickelhaupt; EJ Baerends. Rev Comp Chem. Wiley-VCH, New York, 2000.
- KD Sen. Springer-Verlag, Berlin. 1987.
- KD Sen. Springer-Verlag: Berlin. 1993.
- GKL Chan. J Chem Phys. 1999, 110(10), 4710-4723.
- F Kandemirli; S Sagdinc. Corros Sci. 2007. 49(5); 2118-2130.
- D Wang; S Li; Y Ying; M Wang; H Xiao; Z Chen. Corros Sci. 2007; 41(5); 1911-1999.
- NO Eddy; H Momoh-Yahaya; Oguzie. J Adv Res. 2015; 6(2); 203-217.
- Lukovits I; Shaban A; Kalman E. Russian J Electrochem. 2003; 39(2); 177-181.
- MJ Frisch; GW Trucks; HB Schlegel; MA Scuseria GE Robb. Gaussian 03 Revision B.05. Gaussian, Pittsburgh PA, 2003.
- C Lee; W Yang; RG Parr. Phys Rev B. 1988, 37, 785-789.
- RG Parr; RA Donnelly; M Levy; WE Palke. J Chem Phys. 1978, 68, 3801-3807.
- T Koopmans. Atoms Physica1. 1934, (1-6), 104-113.
- RG Parr; RG Pearson. J Am Chem Soc. 1983, 105(26), 7512-7516.
- RG Parr; L Szentpaly; S Liu. J Am Chem Soc. 1999, 121(9), 1922-1924.
- RG Pearson. Inorg Chem. 1988, 27(4), 734-740
- L Vera; M Guzman; YP Ortega-Luoni. J Chil Chem Soc. 2006, 51(4), 1034-1035.
- I Lukovits; A Shaban; E Kalman. Russ J Electrochem. 2003, 39, 177-181.
- I Lukovits; E Kalman. Corrosion (NACE). 2001, 57(1), 3-8.
- MJS Dewar. J Chem Phys. 1977, 99(15), 4899-4907.
- IB Obot; NO Obi-Egbedi. Physicochem Eng Aspect. 2011, 50(4), 2098-2110.
- Z Cao; Y Tang; H Cang; J Xu; G Lu; W Jing. Corros Sci. 2014, 83, 292-298.
- KF Khaled. Electrochimica Acta. 2003, 48(17), 2493-2503.
- IB Obot; NO Obi-Egbedi; SA Umoren. Int J Electchem Sci. 2009, 4, 863-877.
- GG Gece. Corros Sci. 2008, 50, 2981-2992.
- M Lagren; B Mernari; N Chaibi; M Traisnel; H Vezin; F Bentiss. Corros Sci. 2001, 43(5), 951-962.
- M Sahin; G Gece; F Karei; S Bilgic. J Appl Electrochem. 2008, 38, 809-815.
- MA Quraishi; R Sandar. J Appl Electrochem. 2003, 33, 1163-1168.
- IB Obot; ZM Gasem. Corros Sci. 2014, 83, 359-366.
- B Gómez; NV Likhanova; MA Domínguez-Aguilar; R Martínez-Palou; A Vela; JL Gázquez. Phys Chem B. 2006, 110(18), 8928-8934.
- T Chakraborty; K Gazi; C Dulal. Ghosh Mol Phys. 2010, 108(16), 2081-2092.
- NO Obi-Egbed; IB Obot. Corros Sci. 2011, 53, 263-275.
- J Saranya; P Sounthari; K Paranswari; S Chitra. Der Pharma Chemica. 2015, 7, 187.
- P Geerlings; F Proft . Int J Mol Sci. 2002, 3(4), 276-309.
- W Yang; WJ Mortier. J Am Chem Soc. 1986, 108(19), 5708-5711.
- KF Khaled; NK Babic-Samardzija; N Hackerman. Electrochim Electrochimica Acta. 2005, 50(12), 2515-2520.
- J Chen; B Gu; J Eugene; L Boeuf; H Pan; S Da. Chemosphere. 2002, 48(1), 59-68.
- H Tanak; A Ağar; M Yavuz. J Mol Model. 2010, 16, 577-587.

