
Original Articles: 2024 Vol: 16 Issue: 7
N, N'-(1,2-Pheneylene) bis (3,4,5-Trihudroxybenzamide) as Bioactive Ligand Synthesis, Analytical and Anti-Microbial Studies
Esraa O. Ahmed1, Abdou S. El-Tabl2, Eman A. Mohamed2, Islam M. I. Moustafa1*
1Department of Chemistry, University of Banha, Banha, Egypt
2Department of Chemistry, University of Menofia, Shibin El Kom, Egypt
- Corresponding Author:
- Islam M. I. Moustafa
Department of Chemistry, University of Banha, Banha, Egypt
Received: 03-Jul-2024, Manuscript No. JOCPR-24-140579; Editor assigned: 05-Jul-2024, PreQC No. JOCPR-24-140579 (PQ); Reviewed: 19-Jul-2024, QC No. JOCPR-24-140579; Revised: 26-Jul-2024, Manuscript No. JOCPR-24-140579 (R); Published: 02-Aug-2024, DOI:10.37532/0975-7384.2024.16(7).170
Citation: Moustafa IMI, et al. 2024. N, N'-(1,2-Pheneylene) bis (3,4,5-Trihudroxybenzamide) as Bioactive Ligand; Synthesis, Analytical and Anti-Microbial Studies. J. Chem Pharm. Res. 16:170.
Copyright: © 2024 Moustafa IMI, et al. This is an open-access article distributed under the terms of the Creative Commons Attribution License, which permits unrestricted use, distribution, and reproduction in any medium, providedthe original author and source are credited
Abstract
The synthesis and characterization of some metal complexes with new polyhydroxyl amide ligand derived from Gallic acid viz: N, N' -(1,2-phenylene) bis (3,4,5-trihydroxy benzamide), expected to have biological activity, had been synthesized and characterized by different spectroscopic and physical techniques. In solution, the study focused on the formation of Mn2+, Fe3+, Ni2+, Cu2+ and Zn2+ complexes with the newly prepared ligand. Firstly, the stoichiometry of the complexes was determined by conductometric titration then the proton-ligand ionization constants (log Kn H ) and metal-ligand stability constants (log βn M ) were determined by potentiometric titration. The former proved the formation of 1:1 and 2:1 (L:M) complexes while the stability constants were found to be dependent on the effective charge (e/r) ratio of the metal ion. In solid state, metal complexes with different metal ions (Mn2+, Fe3+, Ni2+, Cu2+ Zn2+, Ca2+ and Pb2+) and different anions (SO4 2- , AcO- ) had been successfully prepared and characterized by elemental and thermal analysis, mass spectra, IR, 1HNMR, ESR and TEM techniques. The biological activity of the prepared complexes towards two Gram positive bacterial species (Staphylococcus aureus and Bacillus subtilis), two Gram negative bacterial species (Escherichia coli, Proteus vulgaris), one filamentous fungus (Aspergillus fumigatus) and one yeast species (Candida albicans) was studied using the modified well diffusion method. The optained results showed higher activities of the solid complexes compared to that of the free ligand.
Keywords
Hydroxyl amide ligand; Gallic acid; Transition metal complexes; Conductometry; Potentiometry; Biological activity
Introduction
Gallic acid (3,4,5-trihydroxybenzoic acid) is one of the most abundant phenolic acids in the plant kingdom. It and many of its derivatives have extensive application in the food and pharmaceutical industries and can inhibit the oxidation and rancidity of oils and fats due to their free radical scavenging and antioxidant nature [1]. Many scientific researches on the biological and pharmacological activities of these phytochemicals were reported with emphasis on antioxidant, antimicrobial, anti-inflammatory, anticancer, cardio protective, gastro protective, and neuroprotective effects [2-6]. These compounds can disrupt the integrity of the cell membrane in both Gram positive and Gram negative bacteria and change the charge, hydrophobicity, and membrane permeability of Campylobacter jejune then elevate the antibiotic accumulation in the microorganism [7-10]. Gallic acid can interfere with the Chemo Dynamic Therapy (CDT) provides a new treatment strategy for tumor cells. A variety of CDT agents have been designed by taking advantage of the catalytic property of transition metals, e.g., Fe, Cu, and Mn. Among those nano substrates, Cu-based CDT agents are obviously superior to the other transition metal-based counterparts [11]. Metal complexes derived from bioactive compounds (Gallic acid and others) are being explored for antimicrobial actions and potentially are applicable to provide effective and nontoxic drug candidates having preferred and improved pharmacological activity [12-16]. It should be noted that the presence of metal ions in biological fluids could have a significant effect on the therapeutic action of such organic compounds [17]. Although there are many methods available to study the stability of metal-ligand complexes, the potentiometric method had been used extensively in many branches of solution chemistry and is most frequently used for the study of binary and ternary complexes of transition metals with molecules of biological and pharmaceutical interest [18,19]. In the present work, and in continuation of our study, we provide the synthesis and characterization of Mn2+, Fe2+, Ni2+, Cu2+, Zn2+, pb2+ and Ca (II) complexes with new polyhydroxyl amide ligand derived from Gallic acid. The stoichiometry and stability constants of the complexes are determined in solution by conductometric and potentiometric titrations. The biological activity towards some bacteria, fungi and yeast were also studied.
Materials and Methods
All chemicals used in the present study were of higher-grade Merck or Alderich and were used as received. Second distilled water was used whenever water is necessary. The organic polyhydroxyl amide ligand was prepared by esterification of Gallic acid with ethyl alcohol and condensation with o-phenelynediamine (Figure 1). Solid complexes were prepared by refluxing of metal ion salt (in least amount of ethanol) with ethanolic ligand solution in molar ratio 1:1 or 2:1 (L:M) for about 6 hrs. All techniques and instruments used for characterization of metal complexes are as described in our previous works [20,21].

Figure 1: Gallic acid with ethyl alcohol and condensation with o-phenelynediamine.
Conductometric titration
It was carried out, using YSI Model 32 conductance meter, by titrating 50 mL of ligand solution (10-2 M) with the metal ion solution (10-3 M) added from micro burette with mechanical stirring after the addition of each increment of the titrant. Correction for the dilution effect on the measured conductance was performed by multiplying its value by the factor (Vo+V1/V1) where Vo is the original volume of the solution (50.0 mL) and V1 is the volume of the titrant. The corrected conductance (in μ Mohs) is then plotted as a function of the molar ratio (ligand/metal).
Potentiometric titration
The following solutions were prepared:
(A): 5.0 mL of 0.1 M HCl and 5.0 mL of 1.0 M NaCl.
(B): Mixture (A) + 25 mL of 0.001 M ligand (in ethanol).
(C): Mixture (B) + 2.0 mL of 0.0025 M metal ion solution.
Each solution mixture was completed to 50.0 mL using ethanol and bi-distilled water so as to obtain 40% by volume ethanol. Each mixture was then titrated against 0.02 M NaOH solution containing the same percent of ethanol using an automatic micro burette with constant stirring.
Antimicrobial activity assay
The antimicrobial effect was tested against Staphylo-coccus aureus and Bacillus subtilis as Gram positive, Escherichia coli and Proteus vulgaris as Gram negative bacterial species in addition to one filamentous fungus; Aspergillus fumigatus and one yeast species; Candida albicans using a modified well diffusion method [22]. Briefly, samples are incubated at 37°C for 18-24 hours and are placed in the center of nutrient agar plates which have been inoculated with the test bacteria. The evaluation of this test is based on the level of growth both under and around the sample. The area of no growth is known as a "Zone of inhibition" or "Clear zone" which is proportional to the inhibitory action of the investigated compound [23]. The resulting inhibition zone diameters were measured in millimeters and used as criterion for the antimicrobial activity. Solvent controls (DMSO) were included in every experiment as negative control. Positive controls were also performed using gentamycin as standard antibacterial drugs and the ketoconazole as standard antifungal drug. The lowest concentration showing complete inhibition of growth was recorded as the MIC of the respective sample [24].
Results and Discussion
Part A: Studies on the metal complexes in solutions
In this part, the possibility of complex formation between ligand and Mn2+, Fe3+, Ni2+, Cu2+ and Zn2+ metal ions in solution are discussed. The stoichiometry of the complexes formed was studied by conductometric titration while the proton-ligand stability constant, (log Kn H), of the free ligands and the metal-ligand formation constants, (log βn M), of the complexes were determined by potentiometric titration.
Conductometric titration: The stoichiometry of the complexes formed between Mn2+, Fe3+, Ni2+, Cu2+ and Zn2+ and the ligand under study is determined by conductometric titration. In the present work, the common behavior of the conductance-molar ratio plots is the increase in conductance with increasing volume of titrant (Figure 2). Although the ligand solution has negligible conductance, its addition to the metal ion solution caused a continuous increase in the conductance. The slopes of equivalent-conductivity plots for all ligand-metal ions mixtures showed significant changes when the mole ratio (CL:CM) was about 1:1 and 2:1; thus indicating the formation of a relatively stable 1:1 and 2:1 complexes (L:M) between Mn+ and the ligand (Figure 2).

Figure 2: Conductometric titration of ligand (HL) with, Mn2+, Fe3+, Ni2+, Cu2+ and Zn2+. 

Potentiometric titration: The potentiometric titrations were performed in presence of acid mixture (A) as medium consisting of 0.1 M HCl and 1.0 M NaCl as recommended by Bjerrum [25]. Mixture (A) was mixed with the chelating ligand (HL) of concentration of 1.0 × 10⁻³ M called mixture (B). Mixture (B) was mixed with different metal ions of concentration 2.5 × 10⁻³ M called C1, C2, C3, C4 and C5 for Mn2+, Fe3+, Ni2+, Cu2+ and Zn2+ ions respectively. In all mixtures A, B or Cn, absolute ethanol of 40% (v/v) is enough to keep the components of the mixture in soluble state. These mixtures were then titrated with 0.02 M NaOH freed from carbonate containing also 40% (v/v) ethanol to keep the ratio of ethanol in the titration vessel constant. The potentiometric titration curves of the mixtures are shown in Figure 3. These curves are S-shaped with a sharp jump in mixtures (A) and (B) but relatively smooth curves are obtained with mixtures Cn which contain the metal ions. The end points for the titration of the mixtures increase in the order A< B< Cn (Figure 3).

Figure 3: Potentiometric titration of Ligand (HL) in presence of Mn2+, Fe3+, Ni2+, Cu2+ and Zn2+.

The average number of protons associated with the reagent molecule (n'A) is determined at different pH values using the relation:
 (1)
(1)
Where V1 and V2 the volumes of NaOH required to reach the same pH in the titration curve of acid mixture and the chelating drug, respectively, Vo the initial volume (50 mL), TCLo the total concentration of the drug, Y the total number of dissociable protons attached to the drug, No the normality of NaOH solution and Eo the initial concentration of the free acid. The values of n'A are plotted against pH and the value of proton-ligand stability constants KnH is calculated by interpolation at half n'A integrals (Figure 4).

Figure 4: Formation curve of proton Ligand (HL).
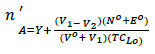
To determine the values of stepwise formation constants of the complexes formed between metal ions and the ligand, the average number of ligand molecules attached per metal ions (n') and free ligand exponent (PL) are calculated using the equations:
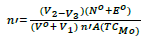 (2)
(2)
 (3)
(3)
Where TCMo the total concentration of metal ion presents in solution, ᵝnH the overall stability constant, V1, V2 and V3 are the volumes of NaOH required to reach the same pH in titration curves in acid mixture, organic ligand and the complex respectively. On plotting the values of n' against PL and interpolating at the half-integrals, the stepwise stability constants of the complexes can be evaluated (Figure 5).

Figure 5: Formation curves of Mn2+, Fe3+, Ni2+, Cu2+ and Zn2+ complexes with ligand (HL). 
The values of log KnH and log Knf gathered from potentiometric titration along with the effective charge (e/r) values are listed in Table 1.
| Complex | logKnH | Step-wise formation constants; logKnf | ||||
|---|---|---|---|---|---|---|
| Mn2+ | Fe3+ | Ni2+ | Cu2+ | Zn2+ | ||
| (e/r) | (e/r) | (e/r) | (e/r) | (e/r) | ||
| HL | logK1H=3.1 | 4.11 | 4.64 | 4.22 | 4.52 | 4.31 |
| logK2H=5.5 | 0.026 | 0.043 | 0.026 | 0.029 | 0.023 | |
Table 1: Proton-reagent stability (log KnH) and stepwise formation (log Knf ) constants of Mn2+, Fe3+, Ni2+, Cu2+ and Zn2+ complexes with ligand (HL).
Part B: Studies on the metal complexes in solid state
All the prepared complexes are nonhygroscopic, having different colours and of high melting points (≥ 180ºC). Elemental analysis measurements showed satisfactory agreement between the proposed and obtained formulae, while molar conductance values indicate their nonionic nature except those prepared from copper sulfate, lead sulfate (Table 2).
| No. | Tentative formula | FW | M.P (ºC) |
Anal./Found (Calc.) (%) |
Conductivity Λ | ||||
|---|---|---|---|---|---|---|---|---|---|
| C | H | N | S | M | |||||
| HL | C20H16N2O8 | 412 | 240 | 58.47 | 4.15 | 7.07 | - | - | - |
| (58.25) | (3.91) | (6.79) | |||||||
| I | ((HL)Mn (OAc)2(H2O)2).2H2O | 621 | 180 | 46.39 | 4.22 | 4.51 | - | 8.84 | 13.5 |
| C24H26MnN2O14 | (46.15) | (4.2) | (4.4) | ||||||
| II | ((HL) Ni (NO3)2 (H2O)2).2H2O | 631 | 210 | 38.42 | 3.05 | 9.17 | - | 9.3 | 14 |
| C20H20N4NiO16 | (38.06) | (3.19) | (8.88) | ||||||
| III | ((HL)Cu (OAc)2(H2O)2).2H2O | 630 | 220 | 47.9 | 4.18 | 4.86 | - | 10.09 | 11.7 |
| C24H26CuN2O14 | (45.75) | (4.16) | (4.45) | ||||||
| IV | ((HL)Cu (SO4) (H2O)3).2H2O | 625 | 301 | 38.75 | 3.4 | 4.75 | 5.23 | 10.15 | 48 |
| C20H22CuN2O15S | (38.37) | (3.54) | (4.47) | (5.1) | |||||
| V | ((HL)2Ni (OAc)2) .3H2O | 1001 | 250 | 53.2 | 3.62 | 5.89 | - | 5.86 | 13 |
| C44H38N4NiO20 | (53.77) | (3.82) | (5.59) | ||||||
| VI | ((HL)2Cu (OAc)2) .3H2O | 1022 | 320 | 52.87 | 4.14 | 5.48 | - | 6.22 | 11.5 |
| C45H42CuN4O20 | (52.94) | (4.17) | (5.36) | ||||||
| VII | ((HL)2Zn (SO4) (H2O)).2H2O | 1004 | 300 | 47.27 | 3.18 | 5.81 | 3.34 | 6.51 | 14.5 |
| C40H34N4O21SZn | (47.84) | (3.41) | (5.58) | (3.2) | |||||
| VIII | ((HL)Ca (OAc)2(H2O)2) 3H2O | 606 | 200 | 47.52 | 4.32 | 4.62 | - | 6.61 | 7 |
| C24H26CaN2O14 | (47.45) | (4.25) | (4.55) | ||||||
| IX | ((HL)Ca (Cl)2 (H2O)2).2H2O | 575 | 190 | 43.83 | 4.2 | 4.87 | - | 6.97 | 9.5 |
| C21H24CaCl2N2O10 | -43.75 | -4.18 | -4.77 | ||||||
| X | ((HL)Pb (SO4) (H2O)3).2H2O | 769 | 210 | 31.21 | 2.88 | 3.64 | 4.17 | 26.92 | 30 |
| C20H22N2O15PbS | -31.19 | -2.85 | -3.6 | -4.1 | |||||
Table 2: Analytical and physical data of ligand (HL) and its metal complexes.
Thermal analysis
The thermo gravimetrical behavior of some selected solid complexes is studied as further support for chemical structure. From the TG curves percent of physically adsorbed and coordinated water molecules were detected and the percent of metal ion in complexes was calculated from the percent of metallic residue remained after complete degradation. Table 3 summarizes the sequence and assignment of degradation steps and show representative thermo gram (Table 3), (Figure 6).

Figure 6: TGA thermal charts of complexes (III) and (IV).
| Complex | Temp. (ºC) | % Wt. loss | Assignment |
|---|---|---|---|
| III | 44.27 | 57.317 | Loss of (H2O) hydrated water molecules. |
| 430.58 | 20.065 | Loss of (H2O) coordinated water molecules. | |
| 666.31 | 12.686 | Beginning decomposition with evolution of N2 and CO2 | |
| Final decomposition of complex leading to CuO | |||
| IV | 47.55 | 23.256 | Loss of (H2O) hydrated water molecules. |
| 322.9 | 45.361 | Loss of (H2O) coordinated water molecules. | |
| 567.06 | 25.907 | Beginning decomposition with evolution of N2 and CO2 | |
| Final decomposition of complex leading to CuO | |||
| VIII | 42.39 | 12.687 | Loss of (H2O) hydrated water molecules. |
| 235.22 | 15.664 | Loss of (H2O) coordinated water molecules. | |
| 313.01 | 31.615 | Beginning decomposition with evolution of N2 and CO2 | |
| 605.28 | 29.273 | Final decomposition of complex leading to CaO | |
| IX | 42.11 | 16.04 | Loss of (H2O) hydrated water molecules. |
| 333.45 | 54.15 | Loss of (H2O) coordinated water molecules. | |
| 580.78 | 21.772 | Beginning decomposition with evolution of N2 and CO2 | |
| Final decomposition of complex leading to CaO |
Table 3: Thermal analysis data for some metal complexes.
Infrared spectra
To through light on the mode of bonding and functional groups participating in complex formation, the IR spectra of the solid complexes were compared to that of the free ligand using KBr disc technique. IR spectrum of the ligand (HL) showed broad band located at 3442 cm-1 and weak band at 3290 cm-1 due to the stretching vibrations of intra-molecular hydrogen bonded OH groups and the stretching vibration of NH2 groups, respectively [26]. The latter band is strongly shifted to lower frequency in the spectra of complexes indicating its contribution in coordinate bond formation. On the other hand, the strong band present at 1604 cm-1 in the spectrum of the free ligand due to the υ (C═O) amide is, more or less, unaffected on the spectra of the solid complexes indicated that this group is not involved in the coordination to the metal ion. A new set of two bands located at 432-635 cm-1 and 533-750 cm-1 appeared in the spectra of solid complexes and were assigned to υ(M-N) and υ (M-O), respectively. Other frequencies (cm1) of different anions of metal salts are cited in (Table 4).
| Complex | ν (H2O) | ν(OH) | Υ NH2 | δOH | ν (OAc/SO4/NO3) | ν(M-O) | υ(M-N) |
|---|---|---|---|---|---|---|---|
| HL | - | 3442 | 3418 | 1385 | - | - | - |
| I | 3439 | 3481 | 3143 | 1319 | 1384, 1274 | 573 | 459 |
| II | 3520 | 3402 | 3150 | 1457 | 742 | 556 | 424 |
| III | 3679 | 3399 | 3257 | 1325 | 1400, 1325 | 750 | 635 |
| IV | 3678 | 3448 | 3141 | 1566 | 1394, 1277,667 | 550 | 458 |
| V | 3510 | 3450 | 3270 | 1504 | 1382,1311,882 | 590 | 452 |
| VI | 3452 | 3384 | 3175 | 1225 | 1,40,51,225 | 612 | 419 |
| VII | 3450 | 3415 | 3275 | 1459 | 1,27,71,107 | 544 | 458 |
| VIII | 3473 | 3430 | 3107 | 1272 | 1,45,61,425 | 586 | 461 |
| IX | 3471 | 3447 | 3068 | 1386 | - | 669 | 611 |
| X | 3505 | 3428 | 3205 | 1240 | 1035,879, 859 | 433 | 418 |
Table 4: IR Frequencies (cm-1) of some important band the ligand (HL) and its metal complexes.
Mass spectra
In combination with elemental and thermal analysis, mass spectra of the solid complexes were measured to ascertain their chemical structure. The technique is accurate and give confidential results. The molecular peaks (m/z; amu) of different fragments are cited with assignment in (Table 5).
| Complex | Mole. ion peak m/z | Assignment | Mole. ion peak m/z | Assignment |
|---|---|---|---|---|
| Free ligand | 76 | C6H4, | 335 | C14H11O8N2 |
| 181 | C12H5O2 | 374 | C17H16O8N2 | |
| 304 | C14H8O8 | 400 | C19H16O8N2 | |
| 412 | C20H16O8N2 (F.Wt | |||
| ((HL)Mn (OAc)2(H2O)2).2H2O (I) | 171 | C6H7O4N2, C10H13O6N2MnC10H16O6N2MnC14H21O7N2Mn | 418 | C15H23O8N2Mn, C21H23O9N2Mn, C22H25O11N2Mn, C24H25O13N2Mn C24H26O14N2Mn |
| 257 | 505 | |||
| 319 | 552 | |||
| 388 | 604 | |||
| 621 | ||||
| ((HL)Cu(OAc)2 (H2O)2).2H2O (III) | 444 | C14H9O11N2Cu, C14H14O11N2CuC16H16O11N2Cu C17H16O11N2Cu | 535 | C18H20O13N2Cu, C20H26O14N2Cu C24H26O14N2Cu |
| 449 | 581 | |||
| 475 | 629 | |||
| 487 | ||||
| ((HL)Cu (SO4) (H2O)3).2H2O (IV) | 192 | C4H4O5N2S, C6H10O5N2S, C7H12O5N2SCuC7H15O6N2SCu | 398 | C11H15O8N2SCu, |
| 222 | 433 | C11H18O10N2SCu, | ||
| 299 | 519 | C14H20O13N2SCu, | ||
| 318 | 601 | C18H22O15N2SCu, | ||
| 626 | C20H22O15N2SCu | |||
| ((HL)2Ni (OAc)2) .3H2O (V) | 276 | C7H6O9N3, C7H6O9N3Ni, C18H14O9N4Ni, C19H14O10N4Ni | 683 | C30H16O12N4Ni, C34H16O14N4Ni, C39H34O19N4Ni C44H39O20N4Ni |
| 335 | 762 | |||
| 488 | 920 | |||
| 516 | 1000 | |||
| ((HL)2Cu (OAc)2) .3H2O (VI) | 121 | C4H11O3N, C4H20O3N, C5H24O5N, C7H26O5N2Cu, | 381 | C14H26O6N2Cu, C25H28O12N2Cu, C36H34O18N2Cu, C42H42O20N4Cu C45H42O20N4Cu |
| 130 | 611 | |||
| 178 | 845 | |||
| 281 | 986 | |||
| 1021 | ||||
| (((HL)2Zn (SO4) (H2O)) .2H2O (VII) | 671 | C22H28O15N3SZn, C24H28O15N3SZn, C27H28O15N4SZn, C35H32O15N4SZn, | 890 | C36H33O17N4SZn, C40H34O18N4SZn C40H34O21N4SZn |
| 695 | 955 \1002 | |||
| 744 | ||||
| 845 | ||||
| ((HL)Ca(OAc)2 (H2O)2).3H2O (VIII) | 477 | C18HO12N2Ca, C18H4O12N2Ca, C19H7O12N2Ca, C20H8O13N2Ca, C20H15O13N2Ca | 544 | C21H16O13N2Ca, C23H19O13N2Ca, C23H21O14N2Ca, C23H26O14N2Ca C24H26O15N2Ca |
| 480 | 571 | |||
| 495 | 589 | |||
| 524 | 594 | |||
| 531 | 606 | |||
| ((HL)Ca (Cl)2 (H2O)2) .2H2O (IX) | 102 | C3H4O3N, C9H11O5N, C12H17O7N2, C18H17O7N2, | 454 | C20H18O8N2Ca, C20H23O9N2Ca C21H24O10N2Cl2Ca |
| 213 | 475 | |||
| 301 | 575 | |||
| 413 | ||||
| ((HL)Pb (SO4) (H2O)3).2H2O (X) | 365 | C5H4O3NSPb, C6H6O4NSPb, C9H6O4N2SPb, C9H10O10N2SPb | 596 | C13H13O10N2SPb, C14H17O12N2SPb, C18H22O15N2SPb C20H22O15N2SPb |
| 394, | 644 | |||
| 445 | 745 | |||
| 545 | 769 |
Table 5: Mass spectral data (Molecular ion peak; m/z; amu) for some selected complexes.
Based on the above mentioned analytical and physical techniques, the mode of bonding and structure of the prepared complexes can be formulated (Figure 7).

Figure 7: The mode of bonding and structure of the prepared complexes.
Electron Spin Resonance (ESR)
The ESR spectra for the two copper complexes (III), and (IV) were measured and their spectral data are presented in Table 6. The spectra are characteristic for those of d9 configuration having axial type of a d(x2-y2) ground state which is the most common for Cu (II) complexes [27]. The complexes showed g||>g┴>2.0023, indicating octahedral geometry around Cu (II) ion [28]. The G values of the complexes are 2.75 and 3.80 i.e G<4.0 indicating that spin-exchange interactions took place between Cu (II) ions [29]. This phenomenon is further confirmed by the magnetic moments values (1.45 and 1.65 B.M.). On the other hand, the ratio of g||/A|| value is also considered as a diagnostic term for stereochemistry [30]. The g||/A|| values for the copper complexes are 170.8 and 223 cm-1 which lie just within the range expected for the tetragonal distorted octahedral Cu(II)complexes. The values of α2 (Cu) for the two complexes calculated as: α2 (Cu) = (A||/0.036) + (g||-2.002) + 3/7 (g-2.002) + 0.04 are 0.6 and 0.58 suggesting a covalent bonding [31].
| Complex | g|| | g^ | gisoa | A|| | A^ | Aisob | G c | g||/A|| | α 2 | ß 2 |
|---|---|---|---|---|---|---|---|---|---|---|
| (G) | (G) | (G) | ||||||||
| (III) | 2.22 | 2.08 | 2.03 | 115 | 10 | 45 | 2.75 | 170.8 | 0.61 | 1.65 |
| (IV) | 2.23 | 2.06 | 2.12 | 95 | 5 | 35 | 3.8 | 223 | 0.58 | 1.34 |
Table 6: ESR data for Cu2+ complexes.
Transmission Electron Microscopy (TEM)
Study of the TEM images of some selected complexes reveals that the average diameter of particles sizes ranges from 43 to 58 nm that are lying in the nano-sized range. Illustrative example is shown in Figure 8 for Cu complex (III) (Figure 8).

Figure 8: TEM images for Cu Complex (III).
Antimicrobial activity assay
The antimicrobial profile was tested against two Gram positive bacterial species (Staphylococcus aureus, (Staph. Aureus) and Bacillus subtilis, (Bacillus subtilis)), two Gram negative bacterial species (Escherichia coli, (Escherichia coli), Proteus vulgaris), one filamentous fungus (Aspergillus fumigatus, (Asp. fumigatus)) and one yeast species (Candida albicans, (Cand. albicans)) using a modified well diffusion method. The resulting inhibition zone diameters were measured in millimeters and used as criterion for the antimicrobial activity with addition to the % Activity Index.
DMSO, used for dissolving the test compounds, was included in every experiment as negative controls and showed no inhibition zones. Positive controls were also performed using gentamycin as standard antibacterial drugs (4 μg/ml) and ketoconazole as standard antifungal drug (100 μg/ml). The antibacterial and antifungal results (Table 7) showed that the organic free ligand showed high activity towards the tested organism compared to the positive controls used as standard drugs and most of the complexes exhibit higher activities than the free ligand except for the Gram positive bacteria, Staph. Aureus, where the solid complexes showed less activity than the organic ligand. The increased activity of metal complexes is explained by the overtone's concept and the Tweedy's theory according to which chelation reduces the polarity of the ligand due to partial sharing of its negative charge with the metal favouring the transportation of the complex across the lipid layer of the cell membrane. On the other hand, the negative results observed in some cases can be attributed to the inability of the complex to diffuse into bacterial cell membranes or it can diffuse by inactivited rout by any cellular mechanism [32-35]. The test was done using the diffusion agar technique, well diameter: 6.0 mm (100 μl was tested), at RCMB: Regional Center for Mycology and Biotechnology.
| Staph. aureus | Bacillus subtilis | Escherichia coli | Proteus vulgaris | Asp.fumigatus | Cand. albicans | ||||||||
|---|---|---|---|---|---|---|---|---|---|---|---|---|---|
| Com. | Inh. zone | % Ac.Ind | Inh. Zone | % Ac.Ind | Inh. zone | % Ac.Ind | Inh. Zone | % Ac.Ind | Inh. zone | % Ac.Ind | Inh. Zone | % Ac.Ind | |
| HL | 21 | 87.5 | 13 | 50 | 12 | 40 | 18 | 72 | 14 | 82.4 | 10 | 50 | |
| 2 | 16 | 66.7 | 15 | 57.7 | 18 | 60 | 18 | 72 | 15 | 88.2 | 12 | 60 | |
| 3 | 9 | 37.5 | 17 | 65.4 | 12 | 40 | 22 | 88 | 17 | 100 | 14 | 70 | |
| 4 | 13 | 54.2 | 20 | 76.9 | NA | NA | 12 | 48 | 17 | 100 | 14 | 70 | |
| 5 | 15 | 62.5 | 19 | 73.1 | 12 | 40 | 18 | 72 | 12 | 60 | |||
| 6 | 17 | 70.8 | 15 | 57.7 | 11 | 36.7 | 17 | 68 | 20 | 117.6 | NA | ||
| 7 | 15 | 62.5 | 17 | 65.4 | 15 | 50 | 20 | NA | NA | ||||
| 8 | 14 | 58.3 | 12 | 46.2 | 12 | 40 | 17 | 68 | NA | NA | |||
| 9 | 16 | 66.7 | 20 | 76.9 | 15 | 50 | 22 | 16 | 94.1 | NA | |||
| 10 | 10 | 41.7 | 22 | 84.6 | 12 | 40 | NA | NA | 13 | 76.5 | NA | ||
| 11 | 12 | 50 | 23 | 88.5 | 18 | 60 | 21 | 16 | 94.1 | 18 | 90 | ||
| Gentamycin (4mg/ml) | Gentamycin (4mg/ml) | Ketoconazole (100mg/ml) | |||||||||||
| 24 | 100 | 26 | 100 | 30 | 100 | 25 | 100 | 17 | 100 | 20 | 100 | ||
Table 7: Antibacterial activities of studied ligand and its tested complexes in terms of inhibition zone diameter (mm) and % activity index.
• Positive control for fungi: Ketoconazole 100 μg/ml.
• Positive control for bacteria: Gentamycin 4 μg/ml.
• % Activity index (%Ac. Ind.) = (inhibition zone of sample/inhibition zone of control) × 100.
• *NA: No activity.
• The sample was tested in 20 mg/ml concentration.
Conclusion
Some metal complexes of transition and non-transitiono metal ions with new polyhydroxyl amide ligand derived from Gallic acid viz: N, N'-(1,2-phenylene) bis (3,4,5-trihydroxy benzamide, expected to have biological activity, had been synthesized and characterized by different spectroscopic and physical techniques. The stoichiometry and stability constants of some complexes were determined by electrometric techniques (conductometric and potentiometric titrations). The biological activity of the prepared complexes towards the Gram positive bacterial species; Staphylococcus aureus and Bacillus subtilis, Gram negative bacterial species; Escherichia coli, Proteus vulgaris, as well as one filamentous fungus (Aspergillus fumigatus) and one yeast species (Candida albicans) was studied using a modified well diffusion method. Gentamycin antibiotics (4 μg/ml) was taken as positive control for bacteria and ketoconazole antifungal (100 μg/ml) as positive control for fungi. It was found that the majority of metal complexes showed high activities compared to the free ligand except that for the Gram positive bacteria, Staph. Aureus, where the solid complexes showed less activity.
References
- Kahkeshani N, Farzaei F, Fotouhi M, et al. Iran J Basic Med Sci. 2019;22(3):225.
[Crossref] [Google Scholar] [PubMed]
- Choubey S, Varughese LR, Kumar V, et al. Pharm Pat Anal. 2015;4(4):305-315.
[Crossref] [Google Scholar] [PubMed]
- Shao D, Li J, Li J, et al. J Food Sci. 2015;80(6):M1299-305.
[Crossref] [Google Scholar] [PubMed
- Borges A, Saavedra MJ, Simões M. Biofouling. 2012;28(7):755-767.
[Crossref] [Google Scholar] [PubMed]
- Kang MS, Oh JS, Kang IC, et al. J Microbiol. 2008;46:744-750.
[Crossref] [Google Scholar] [PubMed]
- Teodoro GR, Ellepola K, Seneviratne CJ, et al. Front Microbiol. 2015;6:1420.
[Crossref] [Google Scholar] [PubMed]
- Oh E, Jeon B. Front Microbiol. 2015;6:1129.
[Crossref] [Google Scholar] [PubMed]
- Nohynek LJ, Alakomi HL, Kähkönen MP, et al. Nutr Cancer. 2006;54(1):18-32.
[Crossref] [Google Scholar] [PubMed]
- Omojate Godstime C, Enwa Felix O, Jewo Augustina O, et al. J Pharm Chem Biol Sci. 2014;2(2):77-85.
- Kubo I, Fujita KI, Nihei KI, et al. Bioorg Med Chem. 2003;11(4):573-580.
[Crossref] [Google Scholar] [PubMed]
- Hao YN, Gao YR, Li Y, et al. Adv Mater Interfaces. 2021;8(24):2101173.
- Sumrra SH, Zafar W, Imran M, et al. J Coord Chem. 2022;75(3-4):293-334.
- Arslan M. React Funct Polym. 2019;139:9-16.
- Fazary AE, Taha M, Ju YH. J Chem Eng Data. 2009;54(1):35-42.
- Badhani B, Sharma N, Kakkar R. Rsc Advances. 2015;5(35):27540-52757.
- Wang X, Cong J, Zhang L, et al. J Agric Food Chem. 2023;71(41):15352-15362.
[Crossref] [Google Scholar] [PubMed]
- Al-Rashdi AA, Naggar AH, Farghaly OA, et al. Am J Anal Chem. 2018;9(3):99-112.
- Al-Mohaimeed AM, Alothman AA. J Chem. 2019;2019(1):1064942.
- Zaid AA, Farooqui M, Janrao DM. J Saudi Chem Soc. 2015;19(1):92-96.
- Abdou S, Abd-El Wahed MM, Abu-Setta MH. Int J Adv Chem. 2018;4(1):17-37.
- Moustafa IM, Mohamed NM, Ibrahim SM. Open J Inorg Chem. 2022;12(3):39-56.
- Morrissey I, Bouchillon SK, et al. J Med Microbiol. 2014;63(4):556-561.
- Abo-Ashour MF, Eldehna WM, George RF, et al. Eur J Med Chem. 2018;160:49-60.
[Crossref] [Google Scholar] [PubMed]
- Ibrahim HS, Eldehna WM, Abdel-Aziz HA, et al. Eur J Med Chem. 2014;85:480-486.
[Crossref] [Google Scholar] [PubMed]
- Shahen I, Ibraheem S, El-Feky F, et al. Egypt J Chem. 2022;65(6):773-790.
- Griesar K, Haase W. J Magn Org Chem 2023;325-344.
- Pei S, You S, Ma J, et al. Environ Sci Technol. 2020;54(20):13333-13343.
[Crossref] [Google Scholar] [PubMed]
- El-Tabl AS, Shaban MT, Abd El-Wahed NM. J Chem Chem Sci. 2019;9(3):74-108.
- Barba FJ, Roohinejad S, Ishikawa K, et al. Trends Food Sci Technol. 2020;100:77-87.
- Delgado F, Lorente N. Prog. Surf. Sci. 2021;96(2):100625.
- Hwang J, Krylov D, Elbertse R, et al. Rev Sci Instrum. 2022;93(9).
[Crossref] [Google Scholar] [PubMed]
- Wagaw S, Buchwald SL. J Org Chem. 1996;61(21):7240-7241.
[Crossref] [Google Scholar] [PubMed]
- Sompila AW, Mabika AB, Pambou-Tobi NP, et al. Am. J. Anal. Chem. 2021;12(12):506-519.
- Smith RL, Soeters MR, Wüst RC, et al. Endocrine reviews. 2018;39(4):489-517.
- Tweedy BG. Phytopathology. 1964;55(8):910-914.