Reviews: 2021 Vol: 13 Issue: 11
Mixed Ligand Chelates of Some Metal Ions: Preparation and PhysiocoChemical Characterizations
Alfakhry BM1, El-ajaily MM1*, Mohamed NM1, Maihub AA1, Al-Noor TH2
1Department of Chemistry, Benghazi University, Benghazi, Libya
Abstract
Three mixed ligand chelates of Fe (III), Ce (IV) and Th (IV) ions wit Schiff base Ligand (HL) formed by the condensation reaction of L-alanine with 2-Hydroxyacetophenol as main Ligand (HL1) and 2-aminophenol as coligand (L2) were prepared and investigated using several physico-chemical tools. The spectral data showed their bonding and electronic transitions.
Keywords
Schiff base; L-anlanine; 2-hydroxyaetophenone; 2-aminophenol; Mixed ligand chelates
Introduction
The Schiff base moieties at the poly functional donor site were widely used in the analytical, biocidal, agrochemical, enzyme models, catalysis, food, chemical, and dye sectors [1,2]. Schiff bases and their complexes were adaptable compounds made by precipitating an amino acid with a carbonyl group [3]. Some enzymes employ the amino group of an amino acid to react with carbonyl (C=O) to generate an azomethine linkage, the azomethine (-C=N) group of Schiff base compounds plays a significant role in many areas, including biological reactions [4,5]. Prepared four mixed ligand complexes of the formula (M‒L(temn)), (where M=Cu (II), Ni (II), Zn (II) and Co (II) ions, L= Schiff base ligand formed by the condensation of L-tryptophan and 2-hydroxyacetophenone and temn- N,N, N, N-tetramethyl ethylene-diamine. The Schiff base and its mixed ligand complexes were characterized by using analytical and spectral tools. All the compounds were examined for their biological activity against some pathogenic organisms (bacteria and fungi). Complexes of cerium (IV) and gadolinium (III) of the formula (Ce(babh)2) (1) and (Gd(babh) (Hbabh))-H2O(2-H2O) have been synthesized by the reactions of Ce (III) and Gd (III)ions with biacetylbis (benzoylhydrazone) (H2babh). The Schiff base and their complexes were studied using several spectral techniques [6].
Materials and Methods
All chemicals used in this investigation were of pure grade (BDH or Aldrich) include; 2-hydroxyacetophenone L-anlanine, 2-aminophenol, DMF, DMSO, NaOH, methanol, ethanol, Fe(Cl)3.6H2O,Ce(SO4)2.4H2O, Th(NO3)4.4H2O, CH3COOH and distilled water. The CHNS analyses for the prepared complexes were made on 2400-CHN elemental analyzer. The molar conductivity was determined in DMF on CMD-650 digital conductivity meter, Ajdabia University. The infrared spectra were carried out on IFS-25 DPUS/IR spectrometer. NMR spectra were recorded on Varian Gemini 200-200 MHz spectrometer using TMS as internal standard in d6-DMSO. The electronic and mass spectra were recorded on Perkin-Elmer lambda-365 spectrophotometer and Shimadzu QP- 2010 Plus spectrometer respectively.
Preparation of amino acid Schiff base
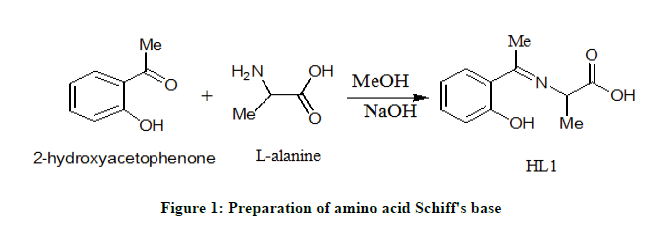
The present amino acid Schiff base was prepared as follows: NaOH (0.4 g, 0.01 mol) was dissolved in 25 mL methanol and L-alanine (0.90 g, 0.01 mol) was added to it. The mixture was stirred at room temperature for 5 minutes. When the mixture becomes homogeneous, 2-hydroxyacetophenone (1.36 g, 0.01 mole) was added. After 2 minutes, the mixture was evaporated to 20% of its original volume and 1 mL of acetic acid was added immediately. After 2 hours, a yellow product was formed. The obtained product was filtered, washed, dried and recrystallized from hot methanol to give pure crystals in excellent yield of 85% (Figure 1).
Preparation of mixed ligand chelates
By adding 2.07 g, 0.01 mole of the Schiff base (HL1) to a methanolic solution (25 ml) of desired metal salts (0.01 mole; 5.52, 4.04 and 2.70 g) of Th (IV), Ce (IV) and Fe (III) ions, respectively, were prepared. In order to adjust the pH value at 8, few drops of 10% sodium hydroxide solution were added slowly until the chelates separated. The mixtures were refluxed for one hour and half, then added 1.10 g, 0.01 mol of 2-aminophenol in 25 ml methanol as co-ligand. The mixtures were again refluxed for extra 3 hours. The formed products were filtered and washed several times with hot ethanol until the filtrates become clear. The obtained mixed ligand chelates were dried under calcium chloride in the desecrator.
Results and Discussion
Micro-analysis and molar conductivity
The CHN elemental analysis data of the Schiff base and mixed ligand chelates offer a good agreement between the calculated and found values indicating the formation of the compounds under investigation (Table 1). Also, the molar conductivity values of the mixed ligand chelates display the existence of non-electrolytic nature [7] confirming the absence of any inorganic anions out the coordination sphere.
| µ B.M | ˄m; Ω-1cm2mol-1 | Elemental analyses Calcd. Found | Color | M. wt | Ligand/chelates | |||
|---|---|---|---|---|---|---|---|---|
| S% | N% | H% | C% | |||||
| ---- | ___ | ---- | 6.76 6.25 |
6.28 5.21 |
63.77 64.20 |
Daffodil | 207 | Schiff base HL1; (C11H13NO3) |
| 6.33 | 0.000582 | ---- | 6.91 7.56 |
5.43 5.01 |
50. 37 50.06 |
Black | 405 | (Fe(L1)(L2)(OH)).H2O |
| 0.00 | 0.00042 | 5.46 6.00 |
4.78 5.35 |
3.92 3.04 |
34.81 34.88 |
Stone | 586 | (Ce((L1)(L2)(SO4)(H2O)).H2O |
| 0 0.0 | 0.00089 | ---- | 6.52 6.03 |
3.58 3.95 |
34.81 34.02 |
Plum | 644 | (Th(L1)(L2)(NO3)(H2O)).H2O |
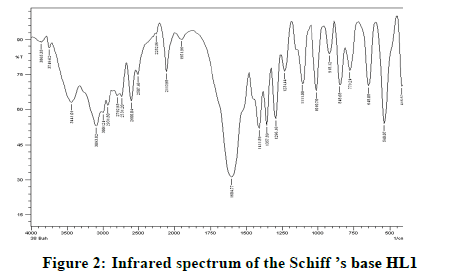
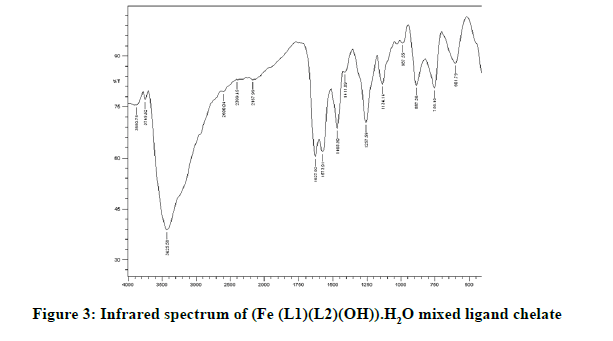
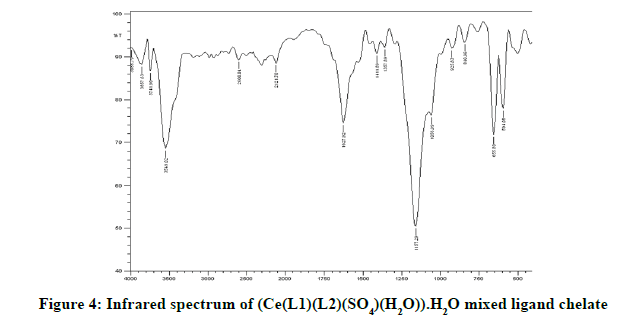
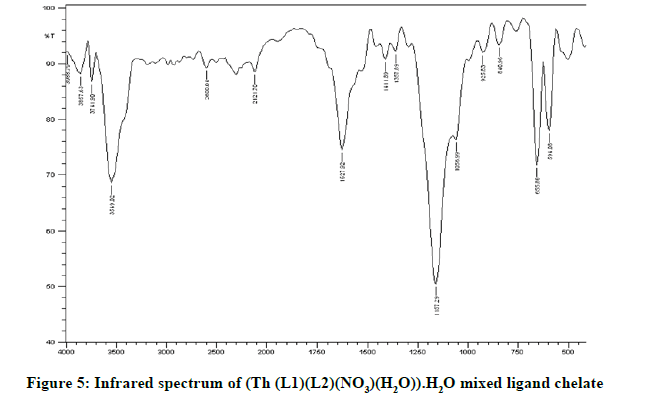
Infrared spectra: The infrared spectral results of Schiff base compound HL1 is shown in Table 2 and its spectrum is shown in Figure 1, the strong broad band that appeared at 3441 cm-1 is due to O-H vibration of the phenolic [8]. This band vanished due to complexation with metal ions. The spectrum shows a band at 1605 cm-1 due to the formation of azomethine group (C=N) [9]. The same spectrum exhibits a band at 3094 cm-1 assigned to υ COOH vibration [10]. The infrared spectra of the L1L2 mixed ligand chelates of (Fe(L1)(L2)(OH)).(H2O), (Ce(L1L2) (SO4)(H2O)).H2O and (Th(L1)(L2)(NO3)(H2O)).H2O are shown in the Figures 2-5 and their band assignments are listed in Table 2. The band corresponds to -NH2 group of the co-ligand 2-aminophenol is overlapped with the bands of crystal water molecules present in the mixed ligand chelates [11]. Meanwhile, the same spectra display a band of azomethine group in the range of 1628-1528 cm-1, the shifting of this group compared to the position of azomethine group in the free Schiff base (1605 cm-1) indicating the involvement of -C=N nitrogen in coordination with the metal ions via a nitrogen atom [12]. In IR spectrum of the Schiff base, the strong broad band at 3441 cm-1 which is assigned to O-H stretching vibration is absent in the spectra of the mixed ligands indicating its involvement in chelation with the metal ions [13]. This evidence confirms the replacement of proton of hydroxyl group and bonding through oxygen atom to the metal ion. The band of υ-COOH in free ligand (3094 cm-1) is absent in the spectra of the mixed ligand chelates supporting the coordination of carboxylic acid group via oxygen atom with the metal ion. The spectra of Ce (IV) and Th (IV) mixed ligand chelates show a band at 840 cm-1 which is due to the existence of water molecule as coordinated molecule [14]. Also the other bands of Th (IV) mixed ligand chelate at 1034 and 756 cm-1 are assigned to the bidentate nitrate group [15,16]. Whereas, the bands in the range of 1056-925 are assigned to the existence of O-SO3 monodentate sulfate group in Ce (IV) mixed ligand chelate [17]. New bands in the range of 756-656 and 602-540 cm-1 attributed to υ (M-O) and υ (M-N) vibrations, respectively, were seen in IR spectra of the mixed ligand chelates [18].
| Ligand/chelates | υ (OH) (H2O) hydrate | υ (C=N) | ͮ υ(M-O) | ͮ υ(M-N) |
|---|---|---|---|---|
| Schiff base HL1; (C11H13NO3) | 3441 | 1605 | - | - |
| (Fe (III)(L1)(L2)(OH)).H2O | 3426 | 1627 | 756 | 602 |
| (Ce(IV)(L1)(L2)(SO4)(H2O)).H2O | 3549 | 1628 | 656 | 594 |
| (Th(IV)(L1)(L2)(NO3)(H2O)).H2O | 3418 | 1582 | 671 | 540 |
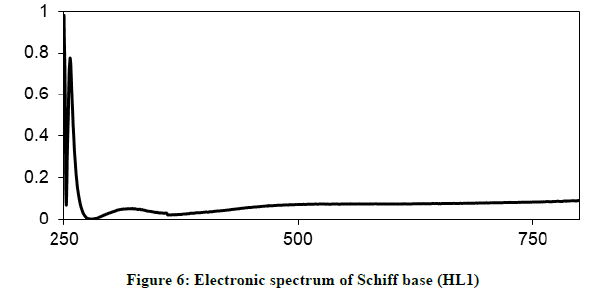
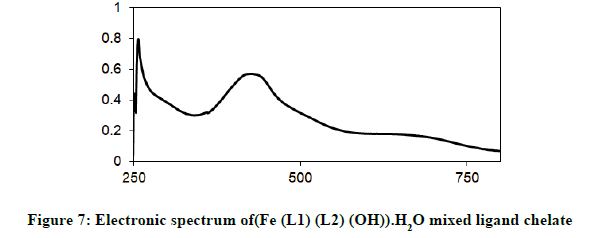
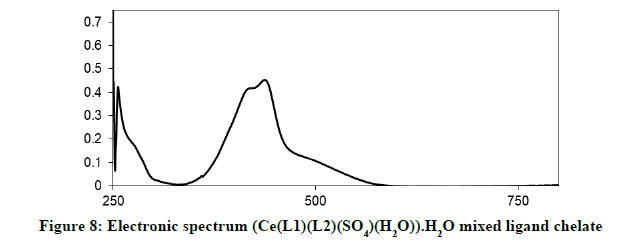
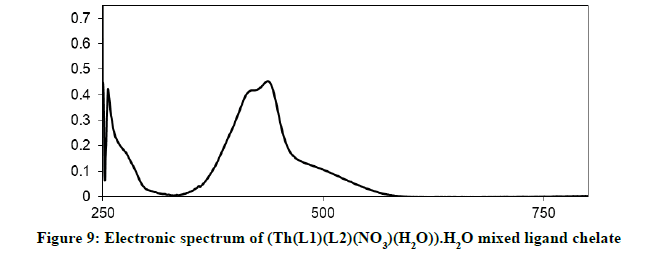
Electronic spectra and magnetic moments: The spectrum of the Schiff base (HL1) exhibits absorption bands at 260 nm (38711 cm-1) and 313 nm (31949 cm-1) corresponding to π→π* (phenyl ring) and n→π* transition, respectively [19]. The electronic absorption spectrum of Iron (III) chelate shows four bands at 354 nm ( 28249 cm-1), 427(23419 cm-1), 576(17361 cm-1) and 681 nm (14681 cm-1), the first band owing to charge transfer and the other three bands corresponding to 6A1g (S)→4T1g (G), 6A1g (S)→4T2g (G) and 6A1g (S)→4Eg, 4A1g (G), respectively [20-22]. The magnetic moment value of this chelate is (6.33 B.M) indicates the presence of paramagnetic character [Figures 6-9]. Based on these data, an octahedral geometry was suggested for the chelate [23]. The electronic spectra of the cerium (IV) and thorium (IV) mixed ligand chelates display absorption bands in the range of 411-440 (24330-22727) and 407-431 nm (24570-23202 cm-1) respectively, These bands may be related to the charge transfer transitions [24-27], whereas, in the same spectra, the bands in the region at 500-700 nm (20000-14286 cm-1) are not clear, because they due to f-f transition [28-31] [Table 3].
| Compounds | λ nm (cm-1) | assignment |
|---|---|---|
| HL1; (C11H13NO3) | 260 nm (38711cm-1) | *π →π |
| 313 nm ( 31949 cm-1) | n→ π* | |
| (Fe (L1)(L2)(OH)).H2O | 354 nm( 28249cm-1 ) | CT |
| 427 nm ( 23419 cm-1) | 6A1g(S)→4T1g(G) | |
| 576 nm (1736 cm-1) | 6A1g(S) →4T2g(G) | |
| 681 nm (14681cm-1) | 6A1g(S) →4Eg, 4A1g(G) | |
| (Ce(L1)(L2)(SO4)(H2O)).H2O | 411-440 nm | MLTC f-f transitions |
| (24330-22727 cm-1) | ||
| 500-700 nm | ||
| (16667-14286 cm-1) | ||
| (Th(L1)(L2)(NO3)(H2O)).H2O | 407-431 nm (24570-23202 cm-1) | MLTC f-f transitions |
| 500-700 nm | ||
| (16667-14286 cm-1) |
Conclusion
The 1HNMR spectra of the compounds were obtained in d6 DMSO solution as a solvent at room temperature using TMS as an internal reference. In the present study, the 1HNMR spectral signals are depicted. The resonance of protons has been assigned on the basis of their integration and multiplicity pattern. The 1HNMR spectrum of Schiff base HL1; (C11H13NO3) shows two signals at 7.73 and 4.1 ppm which are attributed to the presence of OH proton in phenyl ring and COOH group in amino acid, also the signals at 1.2, 2.3, 3.2 and 2.5 ppm are due to the existence of methyl groups and DMSO solvent, respectively. The aromatic protons have been resonated in the region at 6.4-7.5 ppm. The 1HNMR spectrum of (Ce (L1)(L2)(OH)).(H2O)2) mixed ligand chelate displays the absence of signals due to the OH proton and COOH indicating their replacement by the metal ion during chelation formation. The low intensity singlet peak at 6.3 ppm attributable to water protons. Also the signals at 6.8-7.4 ppm are corresponding to aromatic protons resonate. Whereas, the signals at 1.25 and 2.5 ppm are attributed to the methyl group and DMSO solvent. The singlet at 5.14 ppm is assigned to NH2 group of the 2-aminophenol (L2). The shifting of this group during the chelation process indicates its participation in bonding with metal ions.
References
- Ramu SP, Raman N and Dharmaraja J. Int J Emerging Sci Eng (IJESE). 2013, 1(7): 2319-6378.
- Icini P, Geronikaki A, Incerti M, et al. Bio Org Med Chem. 2003, 11(22): 4785-4789.
- Shabana P, Kumar B, Babu K. Rasayan J Chem. 2021, 14(1): 1408-1414.
- Maihub AA and El-ajaily MM. Academic J Chem. 2018, 3(6): 46-59.
- Lakshmi SS and Geetha K. J Chem Pharm Res. 2016, 8(1): 668-674.
- Ghosh T and Pal SJ. Chem Sci. 2015, 127(7): 1201-1209.
- Thakur GA, Athlekar SV, Dharwadkar SR, et al. Acta Pol Pharm. 2007, 64(1): 9-15.
- F. Karipcin and E. Kabalcilar. Acta Chim Slov. 2007, 54: 242-247.
- Ejidike IP and Ajibade PA. Molecules. 2015, 20(6): 9788-9802.
- Palanimurugan A, Dhanalakshmi A, Selvapandian P, et al. Heliyon. 2019, 5(7): 1-10.
- Alassbaly FS, Maihub AA, Ben-Gweirif SF, et al. Saudi J Pathol Microbiol. 2016, 1(2): 29-35.
- Uddin MN, Abdus Salam MD and Sultana J. Modern Chem. 2015, 3(1): 7-14.
- Malik S, Ghosh S and Jain B. Arch Apll Sci Res. 2010, 2(2): 304-308.
- Al-Jeboori FHA, Al-Shimiesawi TAM, Abd Oun MA, et al. J Chem Pharm Res. 2014, 6(8): 44-53.
- Patil SS, Thakur GA and Shaikh MM. Acta Poloniae Pharmaceutica-Drug Res. 2011, 68(6): 881-887.
- Chowdary MC. Polyhedron. 1987, 6: 285.
- Chandra S and Gupta LK. Spectrochimica Acta Part A. 2005, 61: 269-275.
- Maihub AA, Alassbaly FS, El-Ajaily MM, et al. Green Sust Chem.2014, 4: 103-110.
- Hamil AM, Abdelkarem M, Hemmet M, et al. Int J Chem Tech Res. 2012, 4(2): 682-685.
- Hamil AM, Abdelkarem M, Hemmet M, et al. Int J Chem Tech Res. 2012, 4(2): 682-685.
- Bhadange SG, Mohod RB and Aswar AS. Ind J Chem. 2001, 40: 110-1113.
- Jevtovi VS, Jovanovi LS, Leovac, VM, et al. J Serb Chem Soc. 2003, 68(12): 929-942.
- Drago RS. Surfside Scientific Publisher. 1992.
- Zhang X, Zhang Y, Yang Y, et al. React Inorg Met Org Chem. 2000, 30(1): 45-55.
- Karampurwala AM, Ray A and Patel RP. Inorganic Chem. 1989, 19(3): 219-234.
- Klamm BE,Windorff CJ, Barros CC, et al. Inorg Chem. 2018, 57(24):15389-15398.
- El-ajaily MM, Abdullah HA, Aljanga AA, et al. Asian J Adv Basic Sci. 2014, 3(1): 5-19.
- El-ajaily MM, Al-barki NS, and Maihub AA. Asian J Adv Basic Sci. 2016, 4(2): 123-130.
- Sobola AO and Watkins GM. J Chem Pharm Res. 2013, 5(10): 147-154.
- Sakthikumar KJ D, Raja JD, Sankarganesh M, et al. Indian J Pharm Sci. 2018, 80(4): 727-738.
- Al-barki NS, Maihub AA, El-ajaily M.M, et al. Acad J Chem. 2016, 1(3): 66-75.

