Original Articles: 2021 Vol: 13 Issue: 8
Formulation and In Vitro Evaluation of Salbutamol Transdermal Patches
Abstract
Peroral salbutamol has been widely used to treat bronchospasm which acts by stimulating β-adrenergic receptors. Peroral salbutamol undergoes first pass metabolism extensively to inactive metabolite, shorter biological half-life and administered four times daily that leads to patient incompliance. The low dose, low plasma concentration and low molecular weight with pharmacokinetic limitations make it ideal candidate for transdermal drug delivery systems. However, its low permeability is the main barrier for using it as transdermal patches but it may be solved by adding penetration enhancers. Hence, the aim of this study was to formulate, develop, in vitro evaluate and optimize transdermal patches of salbutamol using different concentrations of film forming and bio adhesive polymers with different penetration enhancers and plasticizer for controlled release of salbutamol and thus to increase the bioavailability of the drug.
Keywords
Salbutamol sulphate; Transdermal patch; Solvent evaporation technique; Penetration enhancer; Anise oil; Eucalyptol oil
Introduction
Nowadays, there is a pharmaceutical orientation to make the skin as part of systemic administration of drugs. Controlled drug release system can be achieved by transdermal drug delivery systems, which deliver medicines via the skin portal to systemic circulation at a predetermined rate over a prolonged period of time. A transdermal drug delivery is a formulation in which the drug concentration remains constant without fluctuations ensuring that drug levels neither fall below the minimum effective concentration nor exceed the minimum toxic concentration. It has many advantages over other routes, such as avoidance hepatic first-pass metabolism, predictable and extended duration of activity, minimizing undesirable side effects and most significantly it provides patients convenience. To date many chemical and physical approaches have been applied to increase the efficacy of the material transfer across the intact skin, by use of the penetration enhancers, iontophoresis, sonophoresis and the use of colloidal carriers such as lipid vesicles (liposomes and proliposomes) and nonionic surfactant vesicles like niosomes and proniosomes [1]. Chemical enhancers are substances to get an optimum percutaneous absorption as they induce a temporary, reversible increase in skin permeability whereas physical enhancers induce the skin permeability by using physical forces such as magnetic field, electric current, vibration etc. For transdermal systems the goal of dosage design is to maximize the flux through the skin into the systemic circulation and simultaneously minimize the retention and metabolism of the drug in the skin.
Transdermal routes of administration cannot be employed for a large number of drugs as the rationality of drug selection is based on pharmacokinetic parameters and physicochemical properties of the drug. Physiochemical factors such as solubility, crystallinity, molecular weight, polarity, melting point, partition coefficient must be considered. After extensive literature survey, salbutamol was selected for this study on the basis of patient compliance due to its frequent dose and prerequisite physiochemical and pharmacokinetic properties for transdermal drug delivery systems. Salbutamol has been widely used to prevent broncho-pulmonary disorders involving bronchospasm. It is a β-adrenergic agonist, which acts by stimulating β -adrenergic receptors. The collected physicochemical and pharmacokinetic data of salbutamol make it a potential candidate to be formulated into transdermal drug delivery system. The dose of salbutamol is 4 mg three to four times a day. The half-life of baclofen is 3-4 hours leading to a short duration of action and frequent dosing to maintain its nanogram therapeutic concentration. By observing the above points, salbutamol is an excellent candidate for transdermal delivery on the basis of its short half-life, small dose, small molecular weight, moderate lipid solubility, melting point, extensive frequent dosing and peak plasma level at nanogram level. The partition coefficient value for salbutamol is about 0.56 which indicates that salbutamol has no sufficient lipophillicity to pass through the skin, so it needs to enhancers to pass through the skin.
A suitable transdermal films should have elastic and bioadhesive characteristics that make them suitable to be in long contact with the skin for the required duration. In addition, it must release the active ingredient in a predictable way to initiate the intended medical response. Therefore, salbutamol must be compatible with the components of these drug delivery systems to avoid any bad effect on the physiochemical properties of these systems. So, in this study, the preparation of salbutamol transdermal films using different polymers, penetration enhancers and plasticizers by solvent casting technique was done.In vitro release study, moisture loss, moisture uptake, thickness, folding endurance, bioadhesion strength and other physical characteristics will be performed to evaluate the prepared films. Therefore, after this study, new dosage form of salbutamol can be used as once or twice daily and this will be useful and offers many advantages over the available formulations of drug related to asthma.
Materials and Methods
Salbutamol sulfate and propylene glycol were kindly supplied as a gift from Yemeni-Egyption Company, Sana'a, Yemen. Hydroxypropyl methyl cellulose was purchased from Global Pharma, Sana'a,Yemen. Sodium alginate was purchased from Sigma chemicals, Cairo, Egypt. Anise oil and Eucalyptol oil were purchased from Loba Chemicals.
Ethyl alcohol was purchased from Al-Shamel Chemicals Co. Sana'a, Yemen. All aqueous solutions were prepared from distilled water. All other chemicals were of analytical grade and provided by Al-Hikma university laboratories, Taiz, Yemen [2].
UV spectrophotometer, Dissolution tester type V, Electronic Balance, Water purifier, Electronic Digital Caliber, Modified Physical Balance (Personal modification), Local Modified Franz Cell, Digital pH Meter, Dry Heat Oven, Heat Magnetic Stirrer and all glassware used were supplied by Al-Hikma university laboratories, Taiz, Yemen.
Solubility studies
The solubility of salbutamol in different solvents separately was studied at room temperature of 25°C. It was carried out by adding excess amount of drug in each case and keeping the excess drug containing flasks on a water bath shaker at 25°C.
Determination of the λ max and the calibration curve of salbutamol in phosphate buffer solution pH 7.4: Small amount of salbutamol was dissolved in phosphate buffer solution pH 7.4. Then by scanning for wavelength from 180 nm -400 nm on the UV spectrophotometer, λ max was measured and recorded. Salbutamol stock solution was prepared in phosphate buffer solution pH 7.4 and then further diluted with phosphate buffer solution to obtain a series of solutions of 1, 2, 3, 4, 5, 6, 7, 8, 9 and 10 μg/ml respectively. The absorbance of these solutions was measured spectro-photometrically at determined λ max, using phosphate buffer solution pH 7.4 as a blank. The standard curve was plotted for entire range of concentrations 1 to 10 μg/ml.
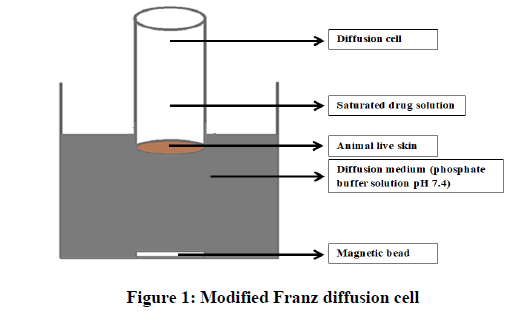
Permeation test of salbutamol through rabbit skin: The permeation tests through rabbit skin were carried out in a modified Franz diffusion cell as diagramed in Figure 1. The skin was carefully shaved by using electronic clipper and insures that all skin layers to be excised except the subcutaneous fat with other blood vessels that were removed and then stored in saline solution for next steps. The skin was rinsed with soap solution, then with purified water for many times [3]. The skin then placed between the donor and receptor compartments of the cell. The dermal side of the skin was directing into the receptor compartment and the stratum corneum facing the donor compartment. The receptor compartment of the diffusion cell was filled with 200 ml of phosphate buffer solution pH 7.4. The donor compartment contained 1 ml solution of salbutamol (10 mg/ml) in phosphate buffer solution pH 7.4. The diffusion cell with fitted rabbit skin was kept inside the beaker containing receptor fluid. The temperature of diffusion medium was maintained at 37°C ± 0.5°C by putting it on controlled hot plate. This whole assembly was kept on a magnetic stirrer and the medium of the receiver compartment was continuously stirred at 50 rpm. The donor compartment was covered to prevent evaporation of the solution. The samples were withdrawn at different time intervals and stored at room temperature until analysis. An equal amount of phosphate buffer solution pH 7.4 was replaced each time.
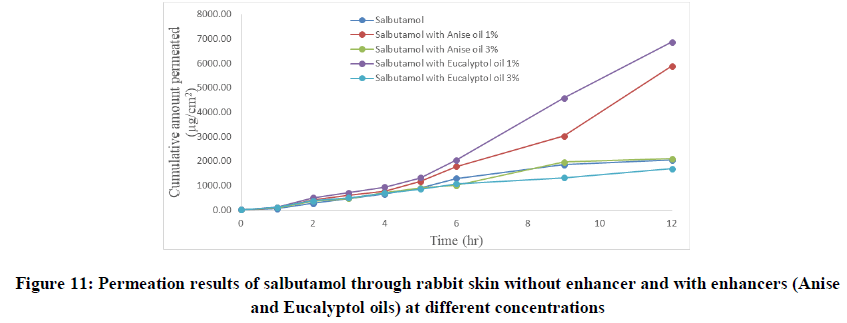
Permeation studies were carried out over 12 hours and samples were withdrawn at 1, 2, 3, 4, 5, 6, 9 and 12 hours from the sampling port. Absorbance of the sample was measured by UV-spectrophotometer at λ max 200 nm. The cumulative amount of drug permeated per square centimeter at each time interval was calculated and plotted against time. The regression analysis of steady state data was done and different parameters (flux rate, permeability coefficient and lag time) were computed [4]. The amount of drug permeated per unit area (Q12) was also obtained. Anise and eucalyptol oils were evaluated for enhancing drug permeation through rabbit skin by using two concentrations (1% and 3%) for both oils.
Compatibility study of salbutamol with excipients
The salbutamol excipients interaction was evaluated using UV spectrophotomer by notifying any change in peak of salbutamol when adding the excipients.
Preparation and preliminary screening of the transdermal films: The preliminary screening was carried out for the selection of best polymers combination. From this step, most satisfactory formulas were fitted to be used in this study to be then evaluated using different physiochemical parameters. It is necessary to incorporate a plasticizer in the films to improve the mechanical properties of the systems. Propylene glycol was used in this study as a plasticizer that produces a reduction in film brittleness and imparts flexibility, thus increasing mechanical strength. To improve the permeation of drug through skin anise and eucalyptol oils were used as penetration enhancers. Transdermal films of salbutamol were prepared by solvent evaporation technique using different polymers to achieve a controlled release. Polymers were soluble in the selected solvent giving clear viscous solution where the drug was completely soluble therefore, good film-forming properties was obtained [5].
Formulation of blank transdermal films: The transdermal films were prepared by the method of solvent casting technique in glass petri dish by using different combined polymers, different plasticizers and penetration enhancers as follow. The mentioned polymers were used to prepare transdermal films with different concentrations in different combinations as presented on Table 1. The calculated quantities of polymers were dispersed in distilled water as a solvent. The polymeric solutions were levigated with different ratios of plasticizer and/or penetration enhancer. The solution was mixed up to get homogeneous mixture and with some polymers up to get semisolid consistency. Then, the polymeric solution was casted on a glass mini petri dish and allowed to dry at room temperature for 24 hours. The dried films were removed and covered with aluminum foil. The drug free films were stored in desiccators until further use. Each dried film was checked visually for any possible imperfections or air bubbles [6]. Films with any imperfections, entrapped air, cracks, fissures or presence of precipitation were excluded from further studies.
| Formulation | Drug | Polymers | Plasticizer | Penetration enhancer | ||
|---|---|---|---|---|---|---|
| Salbutamol sulphate (mg) | SA (mg) | HPMC (mg) | PG (ml) | Anise oil (ml) | Eucalyptol oil (ml) | |
| F1 | 30 | 50 | 100 | 0.15 | 0.1 | |
| F2 | 30 | 50 | 100 | 0.3 | 0.1 | |
| F3 | 30 | 30 | 100 | 0.15 | 0.1 | |
| F4 | 30 | 30 | 100 | 0.3 | 0.1 | |
| F5 | 30 | 50 | 100 | 0.15 | 0.1 | |
| F6 | 30 | 30 | 100 | 0.3 | 0.1 | |
| F7 | 30 | 50 | 100 | 0.3 | 0.1 | |
| F8 | 30 | 30 | 100 | 0.15 | 0.1 | |
Table 1: Composition of different transdermal films
Formulation of salbutamol transdermal films: Salbutamol was dissolved in distilled water containing plasticizer and penetration enhancer constant stirring. The amounts of different components used in medicated films are mentioned in Table 1 and salbutamol (30 mg) was added. Subsequently, HPMC, was mixed with the weighed quantity of bioadhesive polymer (SA). This homogenous mixture was gradually added to the solution of drug with constant stirring. Then, distilled water was added. Once it was fully hydrated and gel consistency was obtained. The medicated gel was poured on to glass petri dish and left overnight at room temperature to ensure clear, bubble-free gel. The gel was cast into glass petri dish and allowed to dry at room temperature until a flexible film was formed. The dried films were removed carefully, covered with aluminum foil and finally stored in desiccators for later evaluation tests [7].
Evaluation of physicochemical characters of transdermal films: The polymer types and excipients have an effect on the physicochemical properties as well as the release rate and permeability of drugs. Therefore, the formulated films were examined in order to select the most satisfactory films. Transdermal films were taken out from each casted film after complete drying and then evaluated for the following physicochemical properties [8].
Visual examination of the prepared transdermal films: Formulated films were evaluated and estimated by visual inspection for their physical appearance including color, elegance, clarity, homogeneity, stickiness, texture, uniformity, smoothness, flexibility, transparency, entrapment of any air bubble or precipitation of drug, which on a large part determines patient acceptability of the film, physical resistance during preparation and storing and also therapeutic efficacy [9].
Film thickness test: It was measured at different points for each film piece by using an electronic digital micrometer (0.001 mm). For each formulation, the thickness of three films was measured and the average of six readings was calculated and standard deviation was determined.
Film flatness test: The flatness was measured manually for the prepared films. An ideal film should be formulated in such a way that it possesses a smooth surface and it should not constrict with time. Flatness studies were performed to assess smoothness and contractibility properties. Longitudinal strips were cut out from each film, one from the center and two from either side. The length of each strip was measured and the variation in the length because of non-uniformity in flatness was measured by determining percentage constriction, considering 0% constriction is equivalent to 100 % flatness [10]. Flatness was determined using below given formula:

Where, L1=Initial length of each strip, L2=Final length of each strip after cutting. The flatness was measured in triplicate and average reading was considered.
Weight variation test: The weight of different prepared films was determined in which three dried films (1 cm2 area) of each formula were taken and weighed individually on a digital balance and the average weights were calculated with standard deviation.
Drug content uniformity test: The salbutamol transdermal films of each formulation of specified area were cut and weighed accurately and then taken into volumetric flask (200 ml) of phosphate buffer solution pH 7.4 and continuously stirred on a magnetic stirrer [11]. Then the solution was filtered, diluted with the same medium if required. The absorbance values of drug was measured by UV spectrophotomer at λ max 200 nm and the mean values of drug content of three films was calculated and expressed as percentage.
Folding endurance test: Three films of each formulation of size (1 cm × 2 cm) were cut by using sharp blade. The folding endurance of the films was determined by repeatedly folding a strip at same point till it broke or up to 300 times. The number of times for film could be folded at the same place without breaking gave the value of folding endurance.
Bioadhesion test: The bioadhesive properties of the patches were successfully tested using the rolling ball tack test. In this test, stainless steel ball of 7/16 inches in diameter was released on an inclined track so that it rolled down and came into contact with horizontal, upward facing adhesive. The distance the ball traveled along the adhesive provides the measurement of tack, which is expressed as average of the stopping distance measurements that shall be reported in millimetres [12].
Percentage moisture content test: To determine the weight loss, the films were weighed individually and the average weight was calculated that was considered as an initial weight. Then all the films were kept in a desiccator containing anhydrous calcium chloride powder at normal room temperature for 24 hr. The final weight was noted when there was no further change in the weight of individual film [13]. The percentage moisture content was calculated as a difference between initial and final weight with respect to final weight. The result weights then calculated according to the following formula:

Percentage moisture absorption test: The films were weighed separately and the average weight was calculated and this weight was considered as an initial weight. Then these films were kept in a desiccators containing saturated solution of potassium chloride (Relative humidity of 75%) at room temperature for 24 hr. The final weight was noted when there was no further change in the weight of individual patch. The percentage moisture absorption was calculated as a difference between final and initial weight with respect to initial weight [14]. The percentage moisture absorption was determined using below formula:

In vitro evaluation of salbutamol transdermal films
In vitro drug release studies: The paddle over disc method (USP apparatus V) as in Figure 2 was determined to evaluate the drug release from the formulated transdermal patches. Dry transdermal patches were cut into certain shape, weighed, and fixed over a glass plate with Alamir glue to fix it as shown in Figure 2. The glass plate was then placed at the bottom of the dissolution vessel filled with a 200 mL of the dissolution medium of phosphate buffer solution pH 7.4, allowing drug release only from the upper side of the film and the equipment was controlled to 37°C ± 0.5°C. The paddle was placed on a distance of 2.5 cm from the glass plate at the bottom of vessel and operated at a speed of 50 rpm. Samples can be withdrawn at predetermined time periods up to 12 hours and recompensed with blank phosphate buffer solution. Then the samples were filtered and analyzed after convenient dilution by UV spectrophotometer at λ max 200 nm. The samples were in triplicate and the mean values were reported and the cumulative percent released can be calculated and plotted versus time [15].
Data ofIn vitro drug release were fit into different kinetic equations and models to determine the most corresponding manner of drug release from the transdermal patches. The kinetic models analyzed were zero order, first order and Higuchi model. For all films, the obtained data from the various formulations were plotted in various different kinetic models and results were interpreted to determine the type of rate order.
To know more accurately the effect of the polymeric mixture on the release of salbutamol, the results must be analyzed regarding to the semi-empirical Korsmeyer-Peppas equation [16].
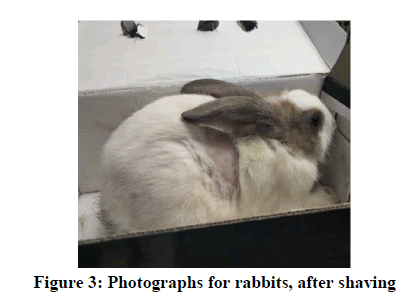
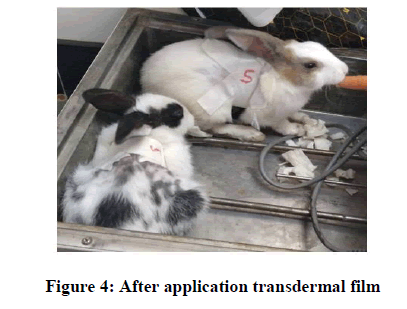
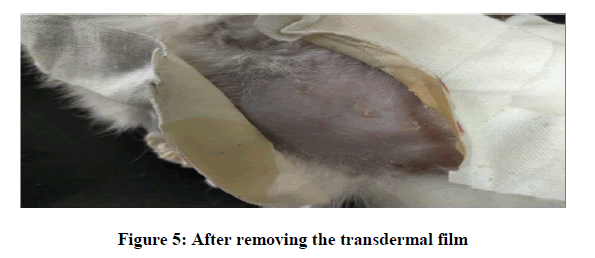
Skin irritation test: Four male rabbits weighing 2-3.4 kg were selected and were fed with standard nutrients and water. The dorsal part of each rabbit was hair removed by an electric razor. The films of area (2 cm2) of blank films (control) and films containing salbutamol were placed to the dorsal shaved part of the skin and fixed by adhesive tape as shown in Figures 3-5 and left for 24 hours. The skin was noticed for appearing any sign of erythema or edema.
Statistics
The means of all data were presented with their standard deviations (mean ± SD). The calculated values of pharmacokinetic parameters were analyzed statistically by the One-way analysis of variance (ANOVA). A statistically significant difference was considered when P<0.05.
Results and Discussion
Pre-formulation studies for baclofen
Solubility studies
Solubility of baclofen was evaluated in different solvents. The results are mentioned in Table 2. Attempts were made at this point to know whether the media phosphate buffer, pH 7.4 was able to maintain sink condition in diffusion as well as in permeation studies. The results of solubility studies revealed that phosphate buffer solutions pH 7.4 was able to maintain sink conditions in dissolution as well as in permeation studies. Thus, phosphate buffer solutions were chosen as the dissolution and permeation media on this study because sufficient amount of drug could be dissolved in it, that is necessary to maintain sink condition [17]. These values of solubilities may be due the dielectric constants of the different solvents as when the dielectric constant increase of solvent increase (as for buffer solutions), the ability to solubilize increase. All the results were complied with that approved by British pharmacopeia.
| Solvent type | Solubility |
|---|---|
| Phosphate buffer (pH 7.4) | Soluble |
| Distilled water | Slightly soluble |
| Ethanol | Soluble |
| Chloroform | Very soluble |
Table 2: Solubility data of salbutamol in different solvents
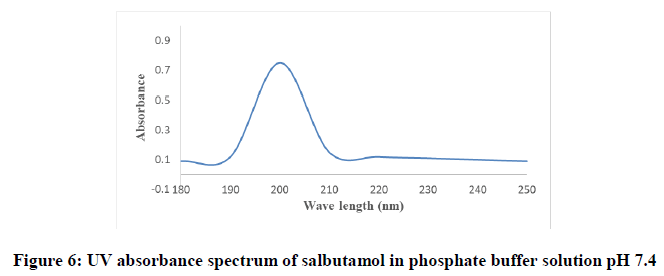
Determination of the λ max and the calibration curve of salbutamol in phosphate buffer solution pH 7.4: The UV maxima of resultant solution were measured with UV Spectrophotometer. The UV maximum of salbutamol in the solution was found to be one single peak at 200 nm which was suitable for the preparation of standard curve and determination of salbutamol in various formulations. Figure 6 shows the UV spectrograph of baclofen in phosphate buffer pH 7.4.
The calibration curve of salbutamol in phosphate buffer pH 7.4 was prepared by measuring the absorbance of the solutions in the range of concentrations 1 to 10 μg/ml at the wavelength 200 nm. The concentration of tested samples and the corresponding absorbance were depicted in Table 3, graphically represented by Figure 7 and the procedural constant (K) was calculated.
| Concentration (μg/ml) | Absorbance |
|---|---|
| 0 | 0 |
| 1 | 0.09 |
| 2 | 0.12 |
| 3 | 0.16 |
| 4 | 0.23 |
| 5 | 0.29 |
| 6 | 0.37 |
| 7 | 0.43 |
| 8 | 0.48 |
| 9 | 0.53 |
| 10 | 0.65 |
| Correlation coefficient=0.9909 | |
| Absorbance=0.0615 × concentration-0.0032 | |
Table 3: The calibration table of salbutamol in phosphate buffer solution pH 7.4 at λ max 200 nm
Permeation study of salbutamol solution through an abdominal rabbit skin
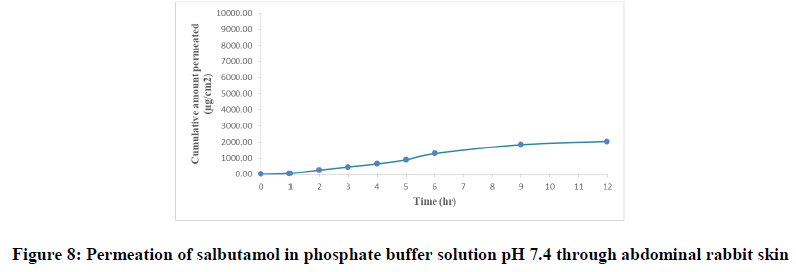
Salbutamol permeability through a rabbit skin without enhancers: In vitro diffusion study is a predictive of in vivo performance of a drug. The amount of drug permeated per square centimeter at each time interval for drug solution was calculated and their cumulative amount is obtained. The cumulative amounts of salbutamol penetrating per unit skin area (Q) were plotted against time as shown in Figure 8 and from the slope of the linear portion of the plot, steady state flux (SSF) was determined. The permeability coefficient (Kp) was calculated as the ratio of SSF and the critical concentration of salbutamol in the formula. Lag time (tlag) was calculated by extrapolation of the linear portion of the plot to the time axis, from lag time and thickness of skin and the cumulative amount of drug permeated per unit area (Q12) were obtained.
The flux of salbutamol through rabbit live skin was 210.30 μg cm-2 hr-1 with time lag 0.6 hr as in Table 4. The permeability coefficient was 0.021 cm h-1. The cumulative amount of drug permeated per unit area after twelve hours (Q12) was 2050 μg cm-2. The results of permeation of pure drug across live animal skin indicated that the salbutamol has poor acceptable permeation characteristics.
| Time (hour) | Cumulative permeated amount (µg/cm2) | ||||
|---|---|---|---|---|---|
| Salbutamol | Anise oil (1%) | Anise oil (3%) | Eucalyptol oil (1%) | Eucalyptol oil (3%) | |
| 0 | 0 | 0 | 0 | 0 | 0 |
| 1 | 65 | 90 | 95 | 107 | 99 |
| 2 | 267 | 400 | 365 | 490 | 387 |
| 3 | 465 | 600 | 470 | 700 | 489 |
| 4 | 653 | 765 | 700 | 941 | 689 |
| 5 | 900 | 1167 | 890 | 1309 | 850 |
| 6 | 1289 | 1780 | 1000 | 2060 | 1067 |
| 9 | 1845 | 3020 | 1960 | 4590 | 1309 |
| 12 | 2050 | 5890 | 2100 | 6870 | 1698 |
Table 4: Permeation of salbutamol solution through abdominal rabbit skin with and without penetration enhancers at different concentrations
Salbutamol permeability through rabbit skin with enhancers: The improvement in percutaneous permeation of drug was due to its low lipophobic nature which partitions difficulty from solution to skin as the partition coefficient of drug was 0.56. The further improvement in flux was done using different skin penetration enhancer, and the small size of device accommodated the requirement of steady state plasma concentration of drug.
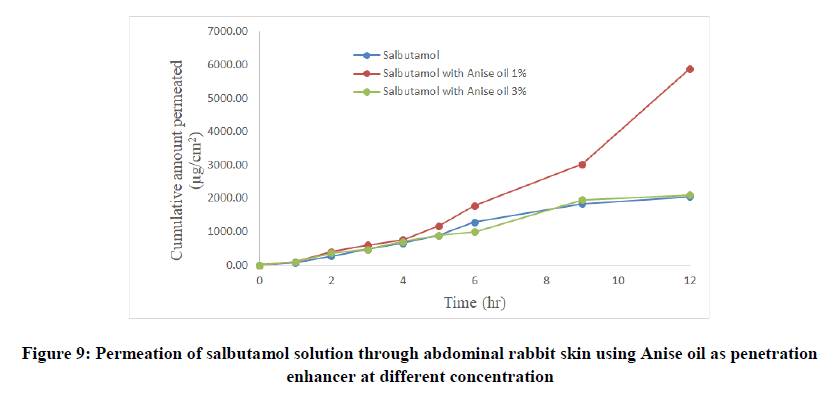
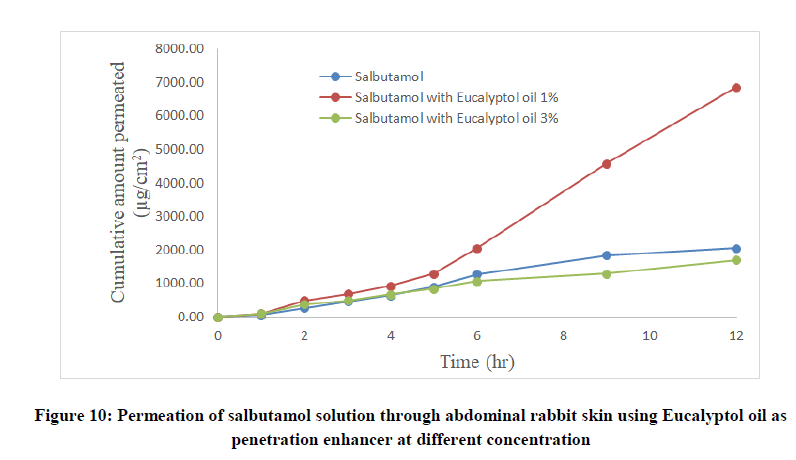
To improve skin flux, chemical enhancers namely, anise oil and eucalyptol oil were incorporated and evaluated. The permeation behavior of salbutamol in presence of skin penetration enhancer was presented in Table 5 and Figures 9-11. The obtained results were clearly showed that the flux of salbutamol was improved by using penetration enhancers but in different ratios.
Compatibility study of salbutamol with excipients
According to different previous studies, it was observed that no possible interaction between different polymers and drug.
| Solution composition | SSF (μg cm-2 h-1) | Q12(μg cm-2) | tlag (h) | Kp (cm h-1) | ER | r2 |
|---|---|---|---|---|---|---|
| Salbutamol solution | 210.3 | 2050 | 0.6 | 0.021 | - | 0.9723 |
| Salbutamol with anise oil 1% | 280.68 | 5890 | 1.5 | 0.028 | 2.87 | 0.9193 |
| Salbutamol with anise oil 3% | 175.89 | 2100 | 0.3 | 0.018 | 1.02 | 0.9723 |
| Salbutamol with eucalyptol oil 1% | 322.68 | 6870 | 1.7 | 0.032 | 3.35 | 0.938 |
| Salbutamol with eucalyptol oil 3% | 178.8 | 1698 | 1.7 | 0.019 | 0.83 | 0.9783 |
Table 5: Permeation kinetic parameters of salbutamol through abdominal rabbit skin as pure solution and using Anise and Eucalyptol oils as penetration enhancer at different concentrations
• SSF: Steady state flux; Kp: Permeability coefficient
• ER=Q12 of drug permeation using enhancer/Q12 of drug without enhancer
Formulation and evaluation of salbutamol transdermal films
Preliminary screening of the transdermal films: An ideal transdermal film should be flexible, elastic, soft, yet adequately strong to withstand removal and breakage caused by daily activities during its residence in the skin. If the film does not have adequate flexibility, it will be uncomfortable after the application. It is necessary to incorporate plasticizers in the films to improve the mechanical properties of the systems. Plasticizers as propylene glycol (PG) were used in this study. The addition of such substance produces a reduction in film brittleness and imparts flexibility. In addition, peel ability is one of the important considerations in the manufacture processes and the films without plasticizer were excluded from the experiments because it was too brittle to conduct further analysis.
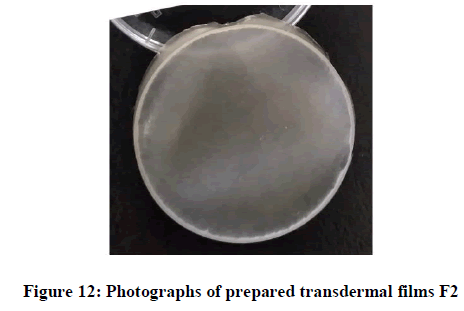
Visual examination of the prepared transdermal films: The formulated films were shown in Figures 12 and it was observed that when using HPMC polymer as a film forming polymer and sodium alginate as a bio-adhesive polymer, the optimum prepared films (from F1 to F8) were uniform, smooth, soft, high to moderate flexible and transparent appearance. They were easy to remove from the petri dish surface, had uniform edges without cracks and no air bubbles or drug precipitation. As seen in the photographs showed in figures, it was observed that, all the formulas meet the ideal properties of physical appearance of patch (Figure 12).
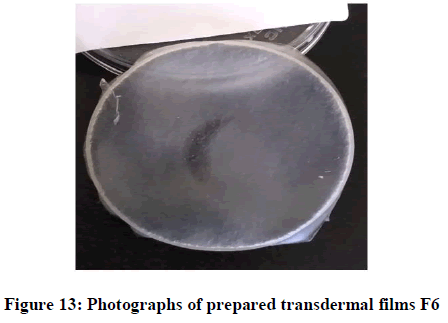
The drug loaded films had the same properties and appearance of the drug free films except the transparency in which the drug-loaded films were transparent with some turbidity and this ensures uniform dispersion of salbutamol in patches. Therefore, based on the physical appearance, it was concluded that only eight formulas were appeared physically acceptable to complete the other physical characterization and others were excluded (Figure 13, 14).
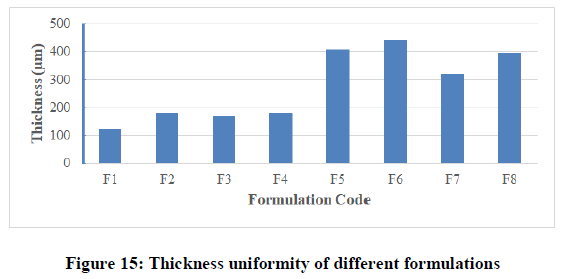
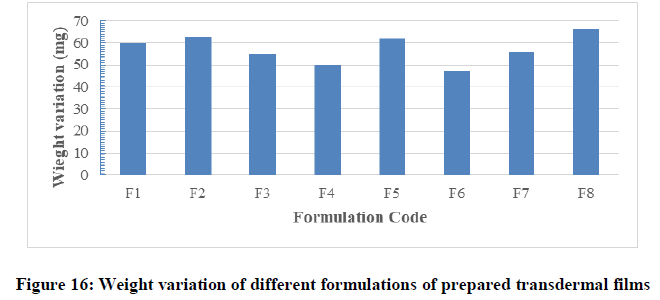
Thickness uniformity test: With the help of electronic digital micrometer (0.001 mm), the thickness of film was measured at six different points and the average thickness was calculated. The results for all formulated films were shown in Table 6 and Figure 15. The results indicated that there was no much difference in the thickness within the same formulation (film thicknesses variation was less than 5%) but there were differences between different formulations due to the variable amounts of polymers used and the differences in the physicochemical properties of the polymers (molecular weight, lipophillicity, solubility, …etc.). Thickness in different formulations was in the range of 123 ± 2.787 μm to 211 ± 1.211 μm. Maximum thickness value was found in formulation F4, while minimum value was found in formulation F2. The results of thickness showed low standard deviation (less than 10 %) that ensures the uniformity of the prepared films and uniform distribution of the drug and polymer over petri dish surface.
| Formulation Code | Thickness(μm) | Flatness (%) | Weight variation(mg) | Folding endurance |
|---|---|---|---|---|
| F1 | 121 | 100 | 60 | More than 300 |
| F2 | 181 | 100 | 63 | More than 300 |
| F3 | 170 | 100 | 55 | More than 300 |
| F4 | 180 | 100 | 50 | More than 300 |
| F5 | 408 | 100 | 62 | More than 300 |
| F6 | 442 | 100 | 47 | More than 300 |
| F7 | 322 | 100 | 56 | More than 300 |
| F8 | 394 | 100 | 66 | More than 300 |
Table 6: Thickness, flatness, weight variation and folding endurance of films
Film flatness test: The results obtained from this test were presented on Table 6 and showed that no one of the formulations had the differences in the strip length before and after their cuts. This indicates 100% flatness in the formulated films and this was complied with Muuadh and Patel. Therefore, no amount of constriction was observed in the film of any formulation indicating smooth flat surface of the films and thus they could maintain a smooth surface when applied on to the skin.
Weight variation test: The patches of certain area were evaluated for weight uniformity and the results obtained were represented in Table 6 and Figure 16. The weight of the prepared films ranged from 47 ± 1.47 mg (F7) to 66 ± 2.18 mg (F8). The weight variation of films was less than 5% in each formula and this was found to be uniform among different batches as mention by Patel. The variations in weight among the different formulations might be due to variation in density of different combination of polymers, different in molecular weight and proportion of the excipients used in the films and moisture content in each formula. In a weight variation test, the pharmacopoeial limit for the percentage deviation of all the films of less than (mg) is ± 10% (B.p, 2009). The average percentage deviation of all formulations was found to be within the pharmacopoeial limit, and hence all the formulation passed the test for weight variation as per official requirements.
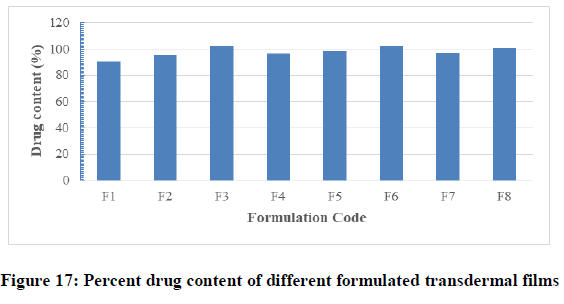
Drug content uniformity test: This test was done to be sure that drug distributed uniformly in each formulated films. The average drug content of prepared medicated films were found to contain between 90.13% ± 0.90% (F1) and 102.10% ± 0.54% (F3) of the labeled amount of drug per film as presented on Figure 17 and Table 7. The average percentage deviation of all formulations was found to be within the limit (± 10%), and hence all the formulations passed the test for content uniformity as per official requirements (B.p, 2009). From the obtained results, it was clear that there was proper evenly distribution of drug throughout the films regardless of the polymer type and proportions. Hence it was concluded that drug was uniformly distributed in all the formulation, with acceptable deviation. Low values of standard deviation (SD) in drug content and previous data reflected that there was no clear change within each batch. The drug content analysis of prepared formulations showed that the process employed to prepared films was capable of giving uniform drug content, with minimum batch variability.
| Formulation Code | Drug content (%) | Moisture content (%) | Moisture uptake (%) | Bioadhesion (cm) |
|---|---|---|---|---|
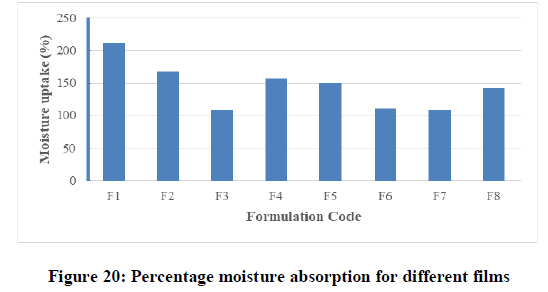
| F1 | 90 | 38 | 212 | 15 |
| F2 | 95 | 123 | 168 | 32 |
| F3 | 102 | 104 | 108 | 27 |
| F4 | 96 | 57 | 157 | 16 |
| F5 | 98 | 91 | 150 | 35 |
| F6 | 102 | 66 | 111 | 50 |
| F7 | 97 | 101 | 109 | 42 |
| F8 | 100 | 98 | 143 | 14 |
Table 7: Drug content, moisture content, moisture uptake and bio-adhesion of films
Folding endurance test: The flexibility of the films that required to be easily handling could be known by their folding endurance. Folding endurance was determined manually for the prepared transdermal films and the results were optimum for all formula with more satisfactory results with F2 and F6. Therefore the films exhibited good physical and mechanical properties as showed on Table 6. All the films resisted breakage upon folding them for more than 300 times at same place and did not show any cracks even after folding for more than 300 times. Hence it was taken as the end point. Also it was noticed that there was low flexibility on formulas composed of 0.15 ml of PG that proved that as plasticizer concentration increased, as the flexibility of film increased. Also it was concluded that as the concentration of drug increased and polymer concentration decreased, the folding endurance decreased and film becomes more friable.
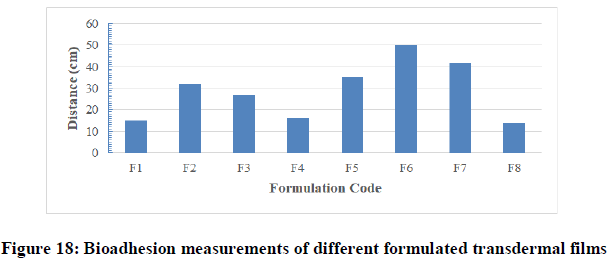
Bio-adhesion test: Bio-adhesion is a very important aspect for maintaining high drug levels at the site of administration and prevents dislodge of patches from the skin. By maintaining effective drug concentration for longer time, one can achieve successful transdermal controlled drug delivery. Measurement of the bioadhesion of the films in this test was therefore of high importance as it was intended to remain in contact with the skin for a prolonged period to facilitate the controlled release of baclofen. According to the Table 7 it was observed that the highest bio-adhesion force was achieved with F8 that was 14 ± 0.59 cm respectively. The results on Figure 18 and Table 7 showed that the low bio-adhesion force that was with formulation F6 of value 50 ± 2.049 cm.
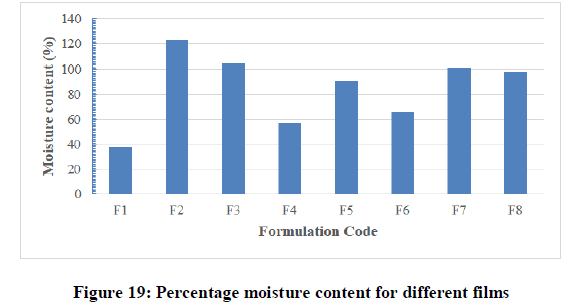
Percentage moisture content test: The results obtained from this test were shown in Table 7 and Figure 19. The moisture content in all the formulations was found to be at a moderate level and ranged from 38 ± 00 to 123 ± 0.699%. The low moisture content in the formulations helps them to remain stable and from being a completely dried and becoming brittle and friable. There are no certain limits for moisture content and moisture absorption of patches.
Percentage moisture absorption test: The results of different formulations were shown in Table 7 and Figure 20. The moisture absorption in all the formulations was found to be high compared to the moisture content and ranged from 108% (F3) to 212% (F1). The results revealed that the moisture absorption was found to be increased with increasing the hydrophilicity of combined materials as explained by Madhulatha and also the presence of PG in formula due to the high ability to absorb the moisture.
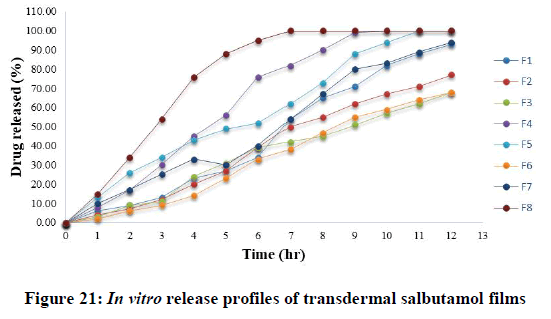
In vitro release studies of salbutamol films: The dissolution study is an important method to evaluate the effect of composition on the drug release rate. The dissolution studies were performed for 12 hours and it was found the permeation rate of the dissolution medium into the films has a profound effect on the drug release rate. The in vitro release profiles of salbutamol from different transdermal films were presented in Table 8.
| Time (hour) | Cumulative percentage released (%) | |||||||
|---|---|---|---|---|---|---|---|---|
| F1 | F2 | F3 | F4 | F5 | F6 | F7 | F8 | |
| 0 | 0 | 0 | 0 | 0 | 0 | 0 | 0 | 0 |
| 1 | 6 | 4 | 3 | 8 | 13 | 2 | 10 | 15 |
| 2 | 9 | 7 | 9 | 17 | 26 | 6 | 17 | 34 |
| 3 | 13 | 12 | 11 | 30 | 34 | 9 | 25 | 54 |
| 4 | 23 | 20 | 24 | 45 | 43 | 14 | 33 | 76 |
| 5 | 27 | 27 | 31 | 56 | 49 | 23 | 30 | 88 |
| 6 | 34 | 39 | 39 | 76 | 52 | 33 | 40 | 95 |
| 7 | 54 | 50 | 42 | 82 | 62 | 38 | 54 | 100 |
| 8 | 65 | 55 | 45 | 90 | 73 | 47 | 67 | 100 |
| 9 | 71 | 62 | 51 | 99 | 88 | 55 | 80 | 100 |
| 10 | 82 | 67 | 57 | 100 | 94 | 59 | 83 | 100 |
| 11 | 88 | 71 | 62 | 100 | 100 | 64 | 89 | 100 |
| 12 | 93 | 77 | 68 | 100 | 100 | 68 | 94 | 100 |
Table 8: In vitro release profiles of all transdermal salbutamol films.
It was apparent from the plots, that the drug release could be sustained and varied with respect to the proportion of polymers. It can be seen that the rate of drug release could be modified in a predictable manner by varying the type and proportion of the polymers used (Figure 21).
In general, it was noticed that, the descending order of drug release was as follow: F8, F4, F1, F5, F7, F2, F3 and F6 respectively. So, salbutamol release was slower from films F3 and F6 that contain HPMC and low amount of sodium alginate with small amount of PG due to the high viscosity of HPMC compared to amount of bioadhesive polymer sodium alginate. This might be returned to the large hydrophobicity, and the consequent lower dissolution and slower erosion of anise oil that prevent the free and deep water penetration into the film.
Regarding the formulation of sustained release, the minimum of 60% of drug release over a 12 h period was desired for the purpose of this study for transdermal delivery. On the one hand, formulations F3 and F6 were the optimum releases that only release less than 70% of drug during 12 hours that means is ideal for sustaining the drug release. The other formulations were failed to sustain the drug release. The final percentages of different formulations at the end of 12 hours were as follow (F1=93, F2=77, F4=100, F5=100, F7=94 and F8=100). In the case of formulations, F3 (T50%=8.73 hr) and F6 (T50%=8.83 hr).
Kinetic analysis of in vitro release data: After exclusion of the bad films, the satisfactory physicochemical formulated films were exposed to in-vitro dissolution studies. Salbutamol release from films was sustained and controlled over 12 hr. To study the mechanism of this release, various kinetic models were applied. Analysis of the release data according to Higuchi model, zero-order and first-order kinetic models and the release parameters were shown in Table 9. The correlation coefficients (r2) of different relations were found to be in the range of 0.921-0.969 for Higuchi diffusion, 0.853-0.994 for zero order and 0.779-0.966 for first order model. The data of salbutamol release were best fitted to the zero order model followed by Higuchi model except F8 that was Higuchi followed by zero order model as shown in Table 9. Therefore, plots of percent release versus time with zero order were found to be linear with r2 values>0.950 in all the cases (except F8) indicating that, the zero diffusion was the release mechanism for all the prepared films.
| Formula code | Correlation coefficient (r2) | ||
|---|---|---|---|
| Zero order equation | First order equation | Higuchi model | |
| F1 | 0.988 | 0.966 | 0.921 |
| F2 | 0.992 | 0.939 | 0.94 |
| F3 | 0.992 | 0.902 | 0.956 |
| F4 | 0.96 | 0.884 | 0.963 |
| F5 | 0.991 | 0.946 | 0.969 |
| F6 | 0.994 | 0.932 | 0.929 |
| F7 | 0.986 | 0.965 | 0.941 |
| F8 | 0.853 | 0.779 | 0.95 |
Table 9: In vitro release kinetics of salbutamol from transdermal films analyzed using Higuchi, first and zero
For more details in release, the results must be analyzed regarding to the semiempirical Korsmeyer-Peppas equation and the values of K, N, and r2 of salbutamol release from the transdermal films were shown in Table 10. The values of N were more than 0.45 for all formulations, indicating anomalous (non-Fickian) release kinetics. Variations in the mechanisms of drug release from all the films were observed. These variations were dependent on different factors including the composition involved in the formulations.
| Formula code | K | N | Time for 50% drug release (hr) | r2 | Release mechanism |
|---|---|---|---|---|---|
| F1 | 0.644 | 0.79 | 6.77 | 0.985 | Non-Fickian |
| F2 | 0.534 | 0.761 | 7.47 | 0.992 | Non-Fickian |
| F3 | 0.541 | 0.785 | 8.73 | 0.988 | Non-Fickian |
| F4 | 0.995 | 0.907 | 4.75 | 0.985 | Non-Fickian |
| F5 | 1.131 | 1.2 | 5.24 | 0.995 | Non-Fickian |
| F6 | 0.31 | 0.676 | 8.83 | 0.996 | Non-Fickian |
| F7 | 0.949 | 1.035 | 6.26 | 0.985 | Non-Fickian |
| F8 | 1.32 | 1.197 | 3.06 | 0.997 | Non-Fickian |
Table 10: In vitro release kinetics of salbutamol from transdermal films, analyzed using Korsmeyer-Peppas equation
Skin irritation test
Results from the skin irritancy study were shown in Figure (3-C) and revealed that, neither control film nor film containing salbutamol caused any noticeable sign of erythema or edema on rabbit skin throughout the period of 12 hours. Hence the transdermal films were found to be compatible and inert with the skin.
Conclusion
From this study, it can be concluded that salbutamol can be formulated as transdermal patches in efficient and convenient manner. Anise and eucalyptol oils had an enhancement role in permeation of salbutamol through skin in concentration not more than 1%. Formulated films in this study had shown many good physicochemical characteristics but formulations F3 and F6 had the most satisfactory characteristics as flexibility, exhibited suitable bioadhesion strength, and sustained controlledIn vitro release (less than 70% after 12 hours), therefore they are the best optimum formulations. Accordingly, researches must be preceded for more investigations as stability study and clinical studies in humans to demonstrate the most appropriate dose and the best pharmaceutical formulations to be used. The formulated salbutamol transdermal film is advised to be used after taking an initial dose of a drug due to this films used as maintenance dose only.
Acknowledgment
All praises to Raheeb Al-Buker and his colleagues in Al-Hikma University, Yemen, Taiz branch, for funding a large part of this research.
References
- Basak SC, Vellayan K. East Pharm. 1999; 40, 63-67.
- Shah SS, Rahul J, Prabhakar P. Asian J Pharm. 2010; 4, 79-86.
- Kelly HW, Murphy S. Ann Pharmacother. 1992; 26, 81-91.
- Khushbu A, Kumar SA, Swaraj P. Int J Pharm Sci. 2011; 3, 50-65.
- Dinesh Kumar S, Sairam R, Maheswaran A, et al. Res J Pharm Bio Chem Sci. 2012; 3, 1132.
- Ahmed M. Sabati. Pharm Chem. 2002.
- Budhathoki U, Thapa P. Asian J Pharm. 2005; 1, 52-56.
- Finin BC, Morgan TM. Int J Pharm Sci. 1999; 88, 955- 957.
- Han T, Das DB. Eur J Pharm Biopharm. 2015; 89, 312–328.
- Pullakandam N, Ashok kJ, Lakshmanaprabu S, et al. Int J Pharm Sci. 50.
- Kapoor A, Lewis S, Venkatesh,et al. Ind Pharm. 2002; 39, 415-418.
- Mbah CJ. Pharm Chem. 2007; 62, 351-353.
- Deksha P. British Pharmacopeia. 2005.
- Higuchi T. J Soc Cos Chem. 1960; 11, 85.
- Peppas NA. Pharm Acta Helv. 1985; 60, 110-1.
- Sanap GS, Dama GY, Hande AS, et al. Int J Green Pharm. 2008; 2, 129-133.
- Shah SS, Joshi R, Praphu P. Asian J Pharm. 2010; 4, 79-86.

